Now this is the thread I'm here for! I've noticed Julia has become very popular for scientific agentic AI code. I guess it's a good language but no one wanted to put the effort in before?
23.02.2026 15:38
👍 1
🔁 0
💬 2
📌 0
I know there have been some Project 2029 memes, but what do we need to make it real?
Fundraising infrastructure outside Act Blue / DNC?
Effective GOTV infrastructure?
The vision for a better tomorrow for all of us is easy. No need for vengeance against anyone, just a plan to make a better country
10.11.2025 08:04
👍 1
🔁 0
💬 0
📌 0

Screenshot of the lesson, showing a radar dish overlaid with text:
"Online Course
Dual-Polarization Fundamentals
1h 30m - 2h
Description
Once an experimental type of weather radar, dual-polarized (“dual-pol”) weather radar is now deployed across the United States and many parts of the world. This lesson will introduce the basic principles of dual-pol weather radar. By the end of this lesson, learners will understand physical meanings of several commonly used polarimetric radar variables, including differential reflectivity, correlation coefficient, differential phase, specific differential phase, and linear depolarization ratio. Examples will be presented demonstrating the distinctive polarimetric signatures of different scatterer types, both meteorological and non-meteorological. Note: This lesson has as a prerequisite the prior lesson, Weather Radar Fundamentals. It is strongly recommended that beginning learners complete that lesson before starting this one."
I am so excited to announce that one of the radar meteorology courses that I developed with @comet-meted.bsky.social is now available! "Dual-Polarization Fundamentals" picks up where "Weather Radar Fundamentals" left off! learn.meted.ucar.edu#/online-cour... (Register on learn.meted.ucar.edu first.)
14.09.2025 17:21
👍 49
🔁 13
💬 1
📌 0
If you can really guide it, I've had great success. I.e. fill out this function and here's how I'll use it. They seem to struggle when given too open ended of a task.
11.09.2025 23:12
👍 2
🔁 0
💬 1
📌 0

What if he does the funniest thing on Friday??
13.08.2025 12:22
👍 1
🔁 0
💬 0
📌 0
Gl gl
14.05.2025 12:42
👍 2
🔁 0
💬 0
📌 0
That's crazy 🤯
02.05.2025 22:29
👍 2
🔁 0
💬 0
📌 0
Whoa what place is that?!
02.05.2025 21:17
👍 1
🔁 0
💬 1
📌 0
Hope you enjoy your stay!
01.04.2025 21:45
👍 2
🔁 0
💬 1
📌 0

Plots of Storm Relative Helicity for non-tornadic, weakly tornadic, and significantly tornadic. There is a clear separation of storm relative helicity values for non-tornado vs tornado cases.

Storm motion comparisons for Bunkers right vs observed storm motion for non-tornadic & tornadic cases. Observed storm motion is to the left of Bunkers for non-tornado cases and to the right for tornado cases
Nice paper by Brice Coffer et al last week that moves us closer to reliable tornado prediction. They resolve issues in model datasets that previously prevented discrimination.
Also they look at how observed storm motion compares to Bunkers in tornado vs non-tornado.
arxiv.org/abs/2503.15466
24.03.2025 13:40
👍 3
🔁 0
💬 0
📌 0

Tough, but fair.
15.03.2025 12:37
👍 523
🔁 58
💬 31
📌 15
100% so cringe
06.03.2025 13:35
👍 1
🔁 0
💬 0
📌 0

An oldie but goodie
03.03.2025 04:50
👍 6
🔁 0
💬 1
📌 0
We somehow need to be able to make space for people to change their minds and be able to switch sides without being brigaded though.
It's not useful to us to demonize them and it forces them back bc they can live with the pain easier than shame & harassment
02.03.2025 16:05
👍 1
🔁 0
💬 1
📌 0
I am mass-ordering Joker paint to prop up consumer spending
01.03.2025 18:24
👍 48
🔁 10
💬 1
📌 0
Curious how it works out for you if you try it. Some peeps rave about it because it stops the positive feedback loop
27.02.2025 05:24
👍 4
🔁 0
💬 1
📌 0
propranolol?
27.02.2025 05:22
👍 3
🔁 0
💬 1
📌 0
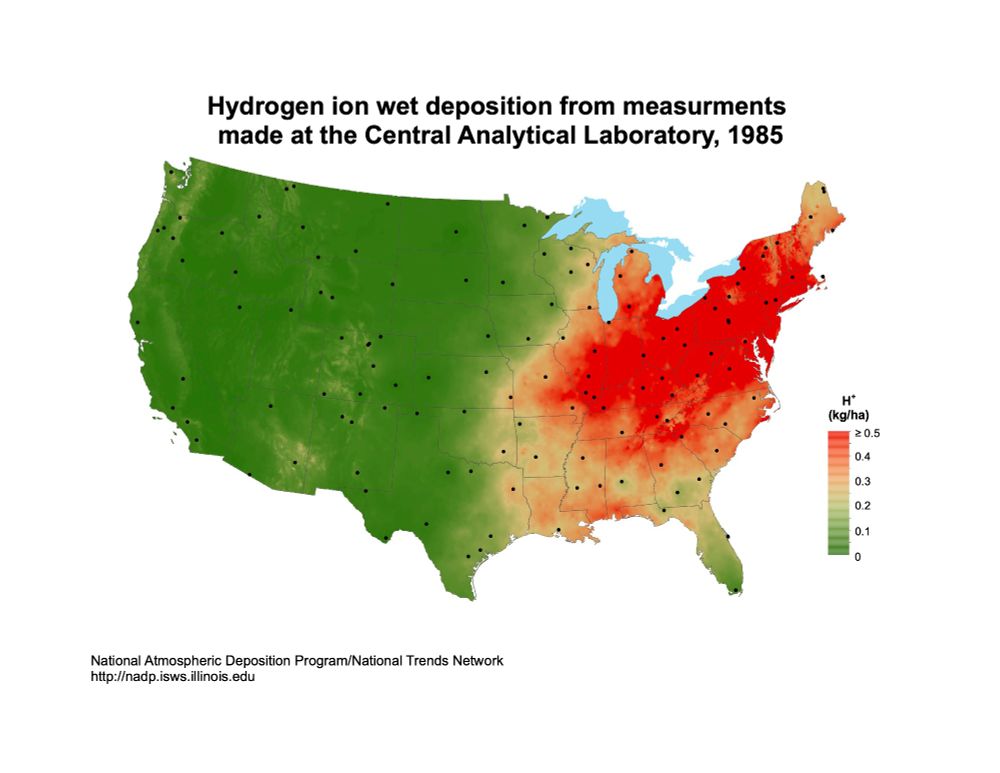
Map of the United States displaying hydrogen ion wet deposition levels from measurements taken in 1985 by the Central Analytical Laboratory. The map uses a color gradient from green (low deposition) to red (high deposition) to show varying levels of H+ deposition (kg/ha). The highest deposition levels are concentrated in the northeastern U.S., while the western U.S. has the lowest levels. Black dots indicate measurement locations. The map is sourced from the National Atmospheric Deposition Program/National Trends Network
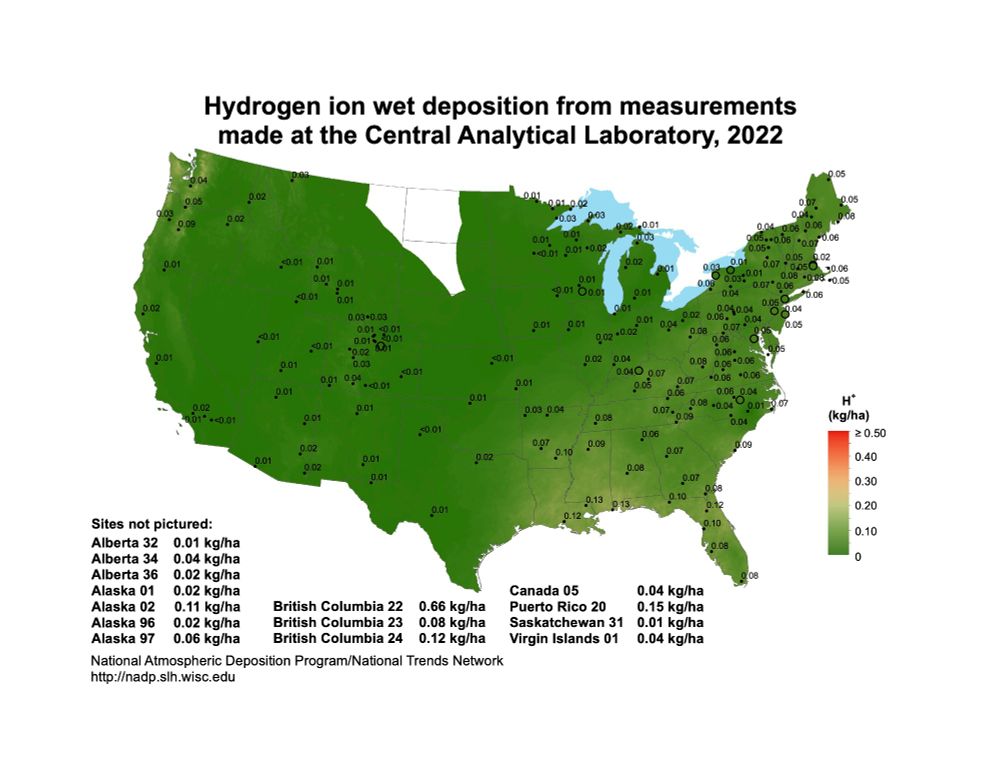
Map showing hydrogen ion wet deposition measurements across the United States and parts of Canada, indicating values in kg/ha for 2022. The color gradient represents different concentration levels, with a scale on the right. Sites not pictured are listed at the bottom. The map is mostly green, indicating that H+ deposition is no longer a environment issue that it once was.
Another dataset I like is from the National Atmospheric Deposition Program, which has maps of the US that show we fixed the acid rain problem by implementing stricter emission controls on power plants.
nadp.slh.wisc.edu/maps-data/nt...
22.02.2025 15:20
👍 3670
🔁 960
💬 93
📌 58

Nice to see The NY Times feature our work on the next housing affordability crisis: climate change.
10.02.2025 13:31
👍 3
🔁 0
💬 1
📌 0
The Hidden Climate Tax: How Climate Change Increases Energy Demand and Costs For Society
Talk from 2025 American Meteorological Society meeting in New Orleans, LA.
Jan. 2025
Abstract: This study demonstrates how climate change is already driving large increases in electricity demand and total electricity costs. This occurs due to two things: hotter temperatures drive higher demand (m
A recording of my talk at the recent AMS meeting:
The Hidden Climate Tax: How Climate Change Increases Energy Demand and Costs For Society
youtu.be/FoAo_a612XQ
01.02.2025 19:49
👍 66
🔁 25
💬 1
📌 4
Is this about Vision Pro 🙏🏼
30.01.2025 23:16
👍 1
🔁 0
💬 1
📌 0

PDF of tornado warning duration from October 1999-Sept 2003, when directive said warnings should be from 30-60 minutes in duration, and Oct 2003-Sept 2007, when directive changed to 15-45 minutes in duration. Distributions show almost no change. Early (late) 70.6% (70.6%) from 30 to 60, 66.9% (62.8%) from 15 to 45.
More NWS tornado warning trivia. In Oct 2003, the directive for duration changed from "should be 30 to 60 minutes" to 15 to 45 minutes. Plot shows pdf 4 years before and after official change. Early (late) 70.6% (70.6%) from 30 to 60, 66.9% (62.8%) from 15 to 45.
16.01.2025 17:25
👍 9
🔁 2
💬 0
📌 0
G'morning
15.01.2025 13:28
👍 2
🔁 0
💬 0
📌 0
Lmaoooooo
28.12.2024 04:36
👍 1
🔁 0
💬 0
📌 0
Never really appreciated the last time I had honey roasted peanuts and a plastic cup on Southwest.
22.11.2024 01:37
👍 4
🔁 0
💬 0
📌 0
You might not make the lists but you are easily one of my favorite follows on these platforms!
09.11.2024 16:00
👍 1
🔁 0
💬 0
📌 0
We got the memes from @stormchasernick.bsky.social that's all we really need
17.10.2024 00:35
👍 2
🔁 0
💬 0
📌 0