we have a Richard Feynman prospect here
04.11.2024 22:15
👍 0
🔁 0
💬 0
📌 0
we have a Richard Feynman prospect here

Screenshot of Idaho's 2024 general election results website

Screenshot from the blog post showing how an inline R chunk can create a panel tabset programmatically. --- Finally, we need to concatenate that column into one big string and include it as an inline chunk inside Quarto’s syntax for tabsets: Health and wealth are related in each continent. ::: {.panel-tabset} `r knitr::knit(text = paste0(continents_plots_with_text$markdown, collapse = "\n\n"))` ::: Automatic tabset panels! Here’s what it looks like when rendered: (A plot for Asia, with tabs for other continents)

Screenshot from the blog post showing another example of an inline R chunk creating a panel tabset. This time it shows how a ggplot plot is gradually built up, with a panel for each new layer that's added. --- Let's slowly build up the plot: ::: {.panel-tabset} `r knitr::knit(text = paste0(panels, collapse = "\n\n"))` ::: (A plot showing the relationship between GDP per capita and life expectancy in 2007, with continent colored using the plasma viridis color palette)

Screenshot from the blog post showing an example of multiple continent-specific reports with plots and tables automatically generated with R --- # Continent reports Check out all these automatically generated continent reports! `r knitr::knit(text = paste0(continent_reports, collapse = "\n\n"))` That single inline chunk automatically generates dozens of inline and block chunks of R code before the full document goes through Quarto, which means all this output gets included in the final rendered version:
New blog post! I helped build Idaho's official election results website (with #rstats and #quartopub) and we did some neat stuff to auto-generate hundreds of R chunks. Here's a guide about how to create tabsets and slides programmatically with inline knitr chunks www.andrewheiss.com/blog/2024/11...
New to #MathSky or returning? This may help you get started!
go.bsky.app/66Us7WW
go.bsky.app/LAkKWpR
If you’re a Python person, wave frantically so I can add you to my Python starter pack!
👋🏻👋🏻👋🏻👋🏻👋🏻👋🏻👋🏻👋🏻👋🏻
Bluesky profiles now display on GitHub! 🦋
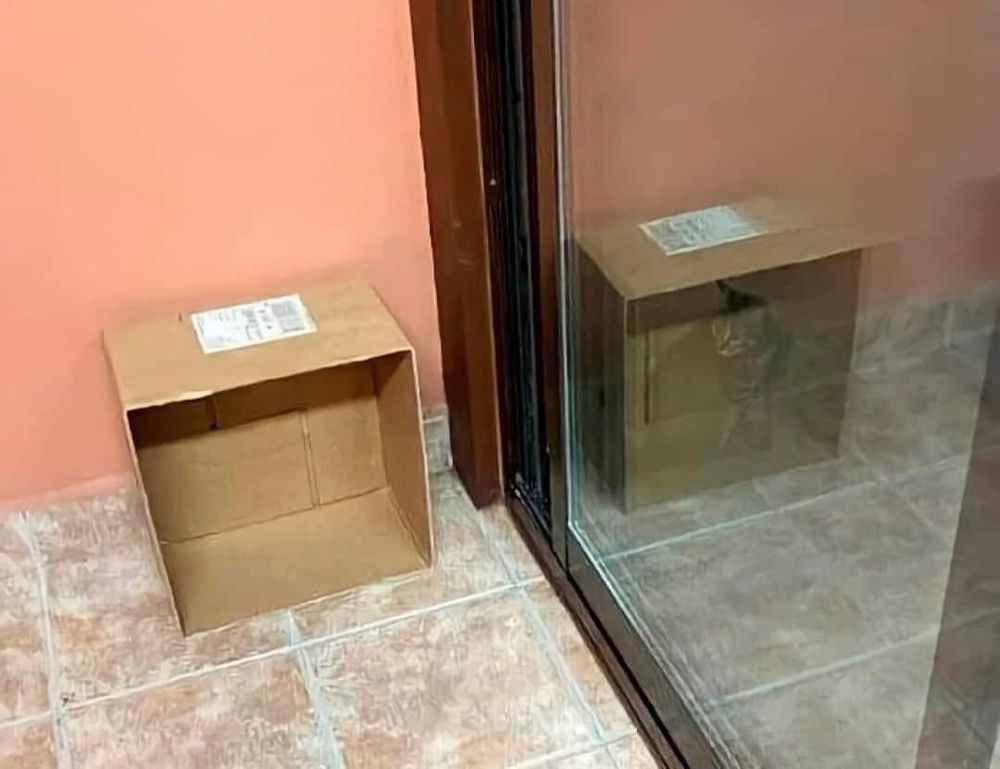
It's a sliding glass door in a kitchen and on one side there's an empty box but it is lying on its side so that it's open. Face is tipped over. Then outside there is a cat sitting outdoors, looking inside, but the way the picture is composed the reflection of the box superimposes on the cat. So in one of the reflections it looks like the cat is in the box and the other box is empty
Ladies and gentleman and vastly more interesting genders: we got him. We finally caught Schrodinger's cat.
neither of the two gives up the mutual relationship they have, if they touch, as in an intersection, algebraically the solution will be values that make their equations equal to zero... they cancel each other out.
the hyperbola is attracted to the asymptote but never allows the hyperbola to touch it. what happens then? the nature of the hyperbola and the asymptote 'evolves': the hyperbola never stops advancing and the asymptote creates a dimension that tends to infinity.

here is explained the geometric form of a hyperbola with its algebraic representation.
the dotted lines that form a big x are the asymptotes of the lines of the hyperbola. the asymptote represents the limit (calculus) to which the hyperbola approaches without ever touching it.