
Thanks for your support 🙏
24.11.2025 00:55
👍 1
🔁 0
💬 0
📌 0
Thanks for your support 🙏
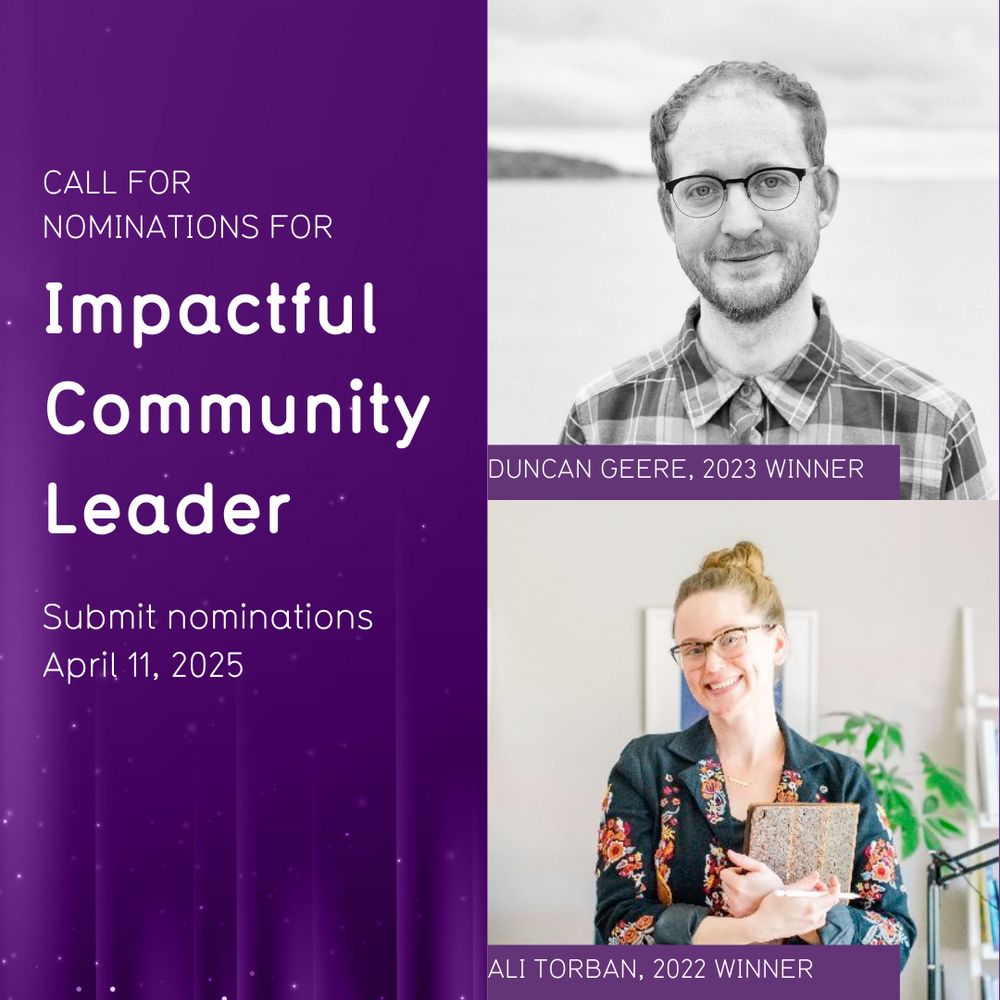


Nominations are open for Impactful Community Leaders. Check out our past years' winners Duncan Geere and @allitorban.bsky.social . Nominations open through April 11, 2025!
Submit your nominations by April 11:
docs.google.com/forms/d/e/1F...

When I was first creating this set in 2021, @allitorban.bsky.social would create a pattern for each animal, then I would make the animal an outfit out of their own pattern. She just reminded me that this #crab got a set of bunny ears. So dashing! 😊
#sciart #artcollab #medart #crabs #illustration
Thanks for coming!!!😍

Learn how @AlliTorban upskilled from a data analyst to #dataviz designer in our upcoming Q&A with an Expert session on January 9. Attend for free by registering here: https://buff.ly/3DGzBE6
Learn how Alli Torban upskilled from a data analyst to data viz designer in our upcoming Q&A with an Expert session on January 9. Attend for free by registering here: https://buff.ly/3DGzBE6📊
Yayyy!!🎉🎉🎉

Image of Alli Torban with her talk title, "step-by-step: how I upskilled from analyst to data visualization designer" with the date and time of the seminar, Jan 9th at 1pm EST.
Join us for our first 📊 Q&A of 2025 with @allitorban.bsky.social!
Our new monthly theme is "Upskilling" and Alli is coming in with her best lessons learned and practical advice. Bring your friends and your questions!
Register here: shorturl.at/wV1Jc
@datavizsociety.bsky.social

Santa nailed it this year! 🎅
I won one of @katgreenbrook.bsky.social's 12 Days of Christmas giveaways and got The Data Storyteller’s Handbook + Chart Spark by @allitorban.bsky.social. Perfect summer reading! 🎁 Huge thanks to Kat & Alli for this thoughtful gift.
I hope everyone had a lovely Xmas 🎄

🎉 We turn 6 years old today! Happy Birthday to Us!! 🎂
Our CEO, @benrjones.bsky.social, took some time away from the world and avoided all LLMs while writing this reflective piece about where we've come, and where we're going next:
dataliteracy.com/happy-6th-bi...

Hello world! We're a company that's on a mission to help people learn the language of data and AI, featuring books and courses by @benrjones.bsky.social and @allitorban.bsky.social. Check us out! dataliteracy.com
Aww thanks so much CN 😍😍😍

Podcast recommendation.
It’s strange that this can happen on a one-way broadcast channel, but it’s all about community. Alli curates points of view from a range of data professionals, making a wonderful little internet corner.

Histograms of the distribution of ages for the top 50 professional women’s doubles players in Pickleball and tennis. It shows that the distribution is wider for Pickleball. The distribution for tennis players is around 26 to 32 mostly.
Am I too old to be a professional pickleball player? 🏓 Probably 😅 BUT...
There's still hope! Here’s the age distribution of the top 50 pro women's doubles players in pickleball compared to tennis. Isn't it amazing that 17 year olds and 44 year olds can compete at the highest level together?!😍
Based on your suggestion, I just tried it too…wow! 🫣 I also asked it to suggest areas of improvement and guided questions to help me work on those areas 🤯🤯🤯
Aw thank you Charles!!!

I don't read enough #dataviz books of late, but I took a few hours for @allitorban.bsky.social's #chartspark last week. Well worth it: inspiring, concise, with practical tips you can put to use right away.
Bonus: now I have to revisit Alli's 100 📊 wallpapers project
dataliteracy.com/chart-spark/
Here you go. 🫡
Please share widely to help develop the dataviz community of Bluesky. 📊
go.bsky.app/R3nSyyy
🥰🥰🥰

Is it any surprise that the wonderful @allitorban.bsky.social has written a wonderful book? 📊
Our review of Chart Spark by @videogamefool.bsky.social
chezvoila.com/blog/chartsp...

Comic. First frame shows a clown fish with puffer fish and the clown fish is saying here’s the data set. It’s source the known limitations and it won’t change unexpectedly in the next frame. The puffer fish is puffed up and has hearts.
ways to make your dataviz designer smile 😍🐡
🥲🥲🥲♥️

Six members of the Voilà team sitting around a table. They have laptops in front of them and are looking at a large tv on which the cover page of the book Chart Spark is displayed.
Julian just finished reading Chart Spark by @allitorban.bsky.social and is giving us a debrief.
He loved it and shared some creativity techniques that we could us in our next projects.
Haha I remember that! I practiced so many times 😁

It's book week at Nightingale! This whole week we'll be sharing reviews, author interviews, and book-inspired visualizations.
To start this week off right, we're sharing a review by @emiliaruzicka.bsky.social on @allitorban.bsky.social's newest book, Chart Spark!
nightingaledvs.com/review-chart...

We’re excited to announce The Pudding’s 2024 Cohort, a 10-week summer fellowship for aspiring visual storytellers.
🧑🎓 Open to college/graduate-level students and recent grads
🗓️ June 18 – Sept 1
💰 $7,200 stipend
📝 More details at this link!
pudding.cool/career/cohort/

Analysis and Anarchy, or: there's gold in them thar charts! The latest from CHARTOGRAPHY, with lessons for studying inspiration from @allitorban.bsky.social charts.substack.com/p/analysis-a...
Thank you Andy 🥰🥰🥰
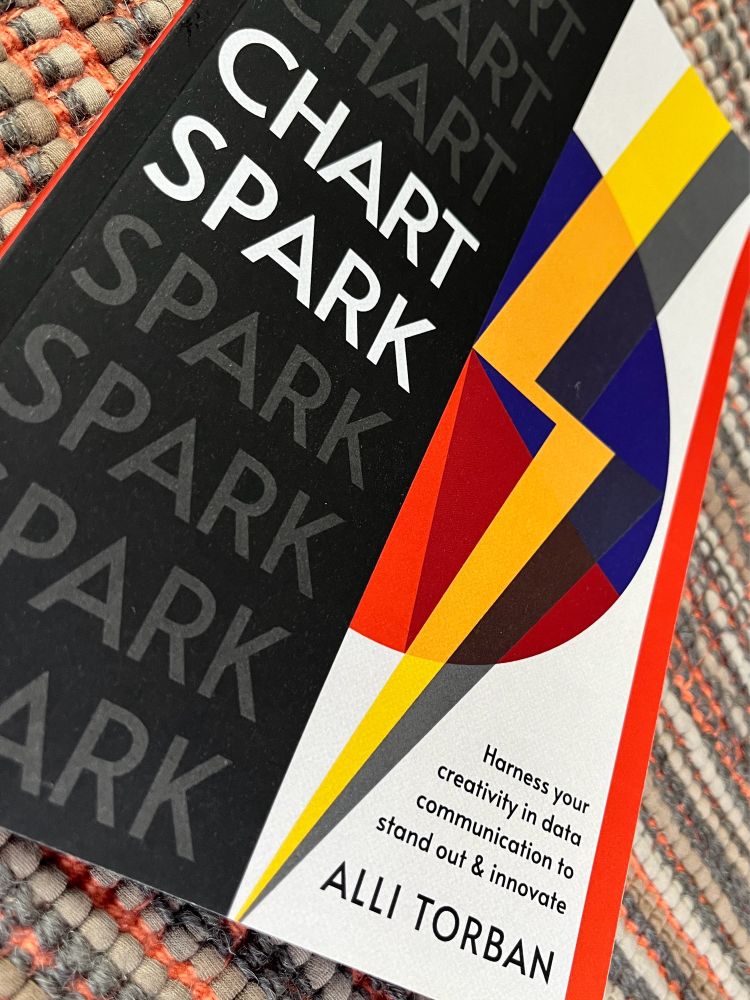


Yet another book has arrived and it’s a massive congratulations to @allitorban.bsky.social, so happy to see her “Chart Spark” book come to life. All about harnessing creativity in the context of data viz, it’s packed with enjoyable drills and beneficial guidance 📊
www.amazon.com/Chart-Spark-...