
Thanks maps.com for featuring our map on arctic reindeer herding! www.maps.com/uncertainty-...
12.11.2025 16:55
👍 6
🔁 0
💬 0
📌 0
Thanks maps.com for featuring our map on arctic reindeer herding! www.maps.com/uncertainty-...
- Permafrost Pathways hosted a community-focused GIS workshop with our tribal liaisons in Anchorage. The maps they made are not just data visualizations, but blueprints for sustainable, community-led change.
Highlights include:
- Ravdna Biret Marja Eira Sara and I presented on our co-produced map of Arctic Reindeer Herding at the Arctic Circle Assembly.

Ravdna and Christina smiling in front of an Arctic Circle Assembly sign.

Christina presenting at Arctic Circle Assembly to a full crowd.

Christina teaching about the importance of map layouts at the GIS workshop in Anchorage for Permafrost Pathways.

Greg Fiske talking about story map techniques at the GIS workshop.
What a whirlwind October! I had the opportunity to travel from Iceland to Alaska, focusing on the power of maps to drive change.

This map from @cmshintani.bsky.social shows the range of the nomadic Dukha reindeer herders on the high taiga of northwest Mongolia.
❄️🚢 Using 6 years of AIS data & NOAA sea-ice records, I tracked vessels completing the Northern Sea Route during seasonal ice retreat. Despite global shocks (sanctions, etc), 2021 saw 92 ships vs just 10 in 2010. Visuals show daily sea-ice + tracks. Data: Kpler & MarineTraffic
This #MapMonday from @maps-and-pepper.bsky.social shows the predicted return period of once-in-a-generation storms.
As climate change increases extreme weather events, we need to prepare with accurate risk information.
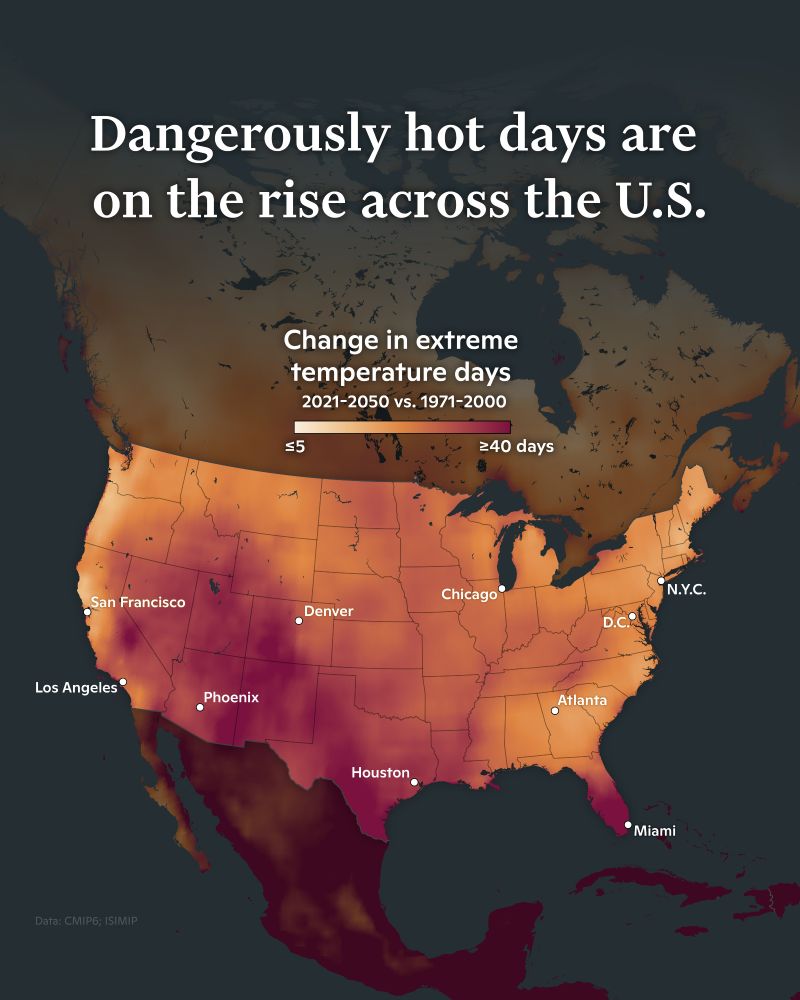
🌡️Have you been feeling the heat this week? Stay informed, hydrated, and safe!
Dangerously hot days are on the rise across the U.S. according to this map from @cmshintani.bsky.social. This week’s extreme temperatures are part of a larger trend of climate change.


Great week at #EsriUC2025 with the @woodwellclimate.bsky.social team! Our @permafrostpathways.bsky.social booth was a hit, making many new connections… and Woodwell maps were everywhere, from the map gallery, plenary, to a main hall mural.
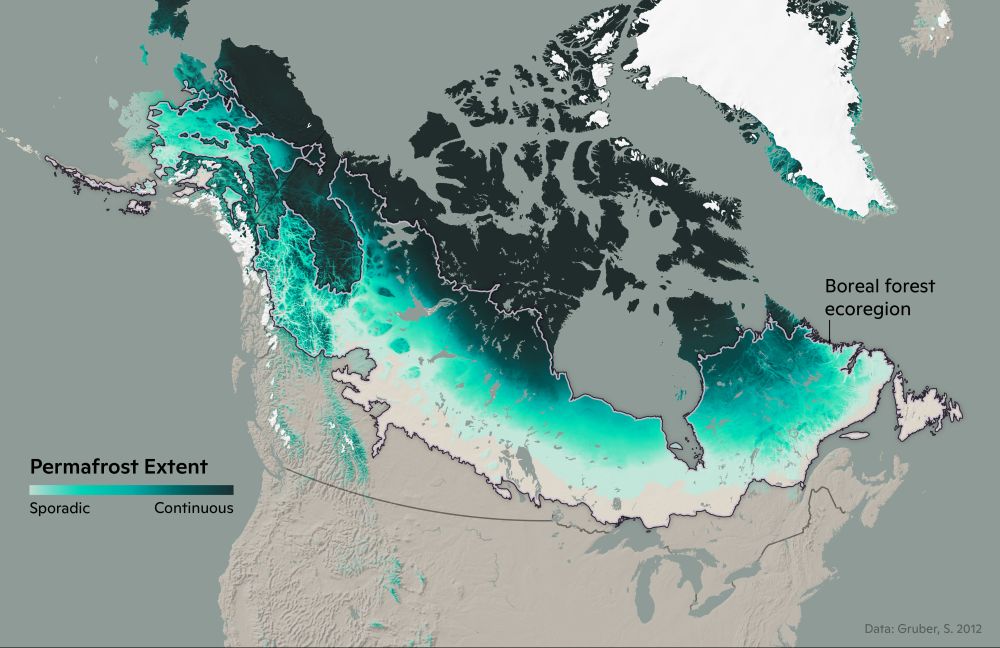
This map from @cmshintani.bsky.social shows the permafrost extant across the boreal forest ecoregion.
Read more about the connection between boreal wildfires and permafrost at www.woodwellclimate.org/connection-b...
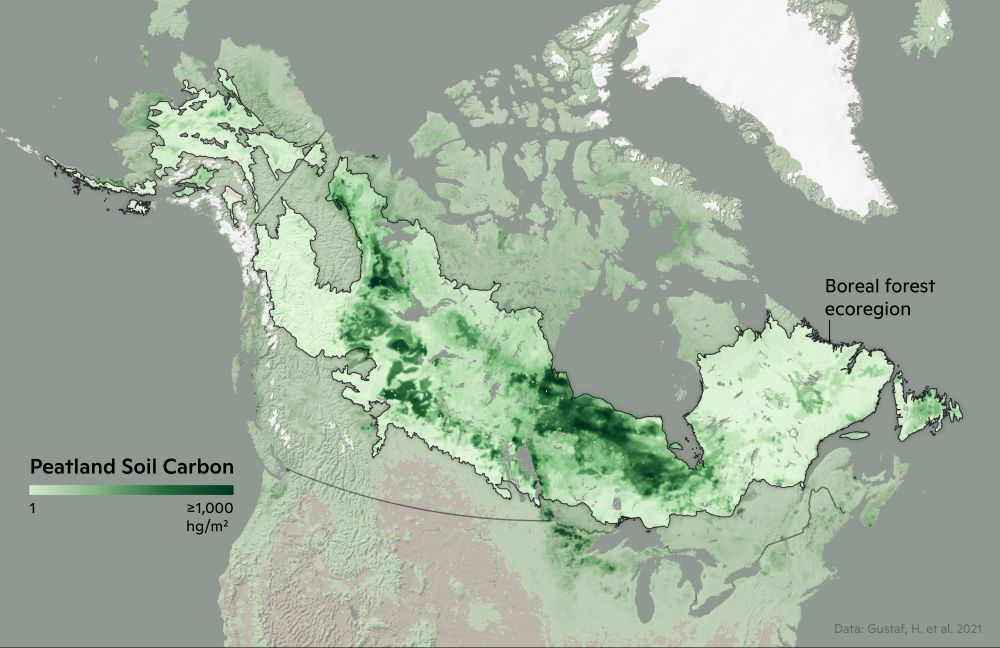
This #MapMonday from @cmshintani.bsky.social shows the carbon stores in peatland soil across the boreal forest ecoregion.
Read more at www.woodwellclimate.org/connection-b...
I really enjoyed working on this map the past few months. If you're in San Diego this week for #EsriUC2025 check it out in the map gallery! mapgallery.esri.com/submission-d...
Very much appreciate the shout out by Jack here for Woodwell maps. This particular map is a @cmshintani.bsky.social original that elegantly highlights a small portion of our nearly two decade research in the Congo.
Looking forward to all the cool maps Nicole @maps-and-pepper.bsky.social will make for Woodwell this summer!

When boreal forests burn, the whole world feels the impact. Research from Woodwell Climate has expanded our understanding of boreal fire impact.
Check out these four graphics from @cmshintani.bsky.social that shed light on the role of boreal fires in climate change:
lnkd.in/evnUbxuC
Unpacking the Recent Heat Wave with an animation of NOAA's Real-Time Mesoscale Analysis (RTMA) data 🗺️
Stay cool this summer folks!
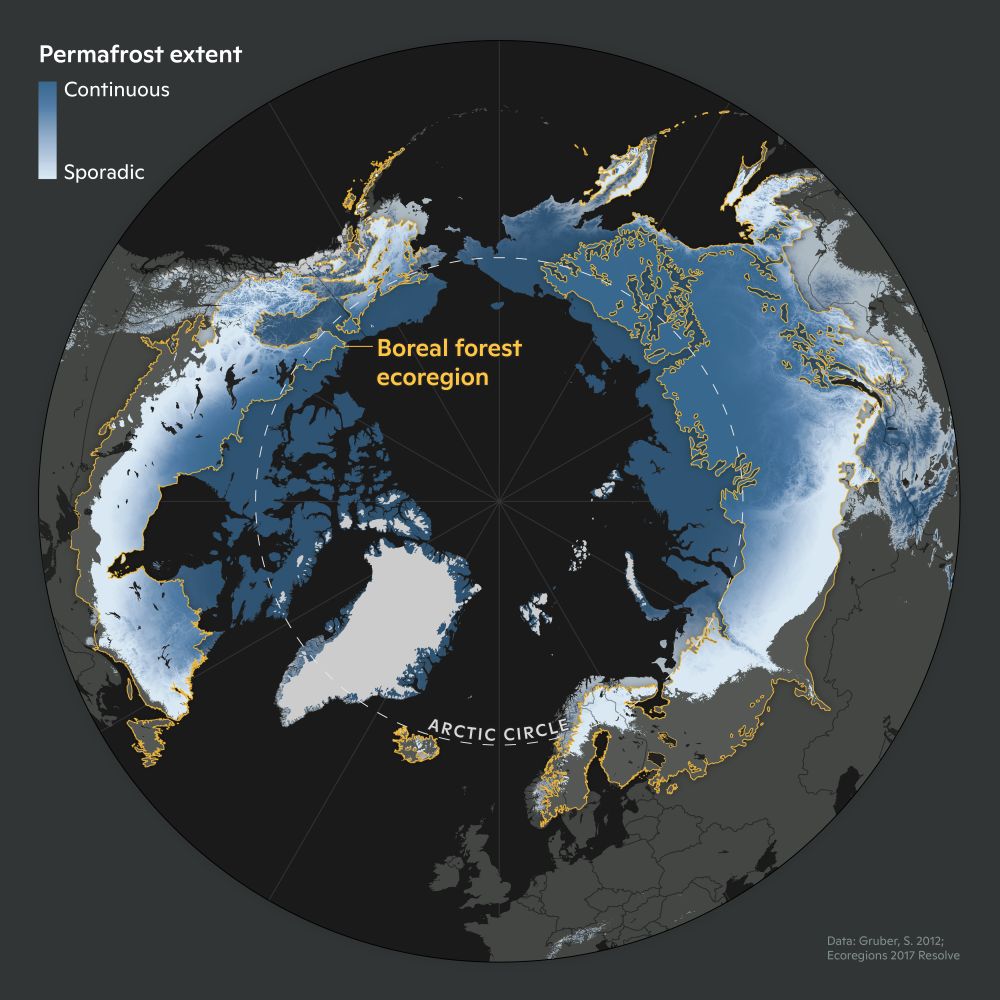
Black, blue, gray and yellow stereographic map depicts permafrost extent and the boreal forest ecoregion in the circumpolar north. Text: Data: Gruber, S, 2012. Ecoregions 2017 Resolve
Our boreal fire team @woodwellclimate.bsky.social is in D.C. this week to discuss responses+solutions to address the severe northern #wildfires impacting people, animals, and ecosystems.
We'll be adding to this resource 🧵, so please let us know what you'd like to see.
(🗺️ by @cmshintani.bsky.social)
Taking a quick peek at firesmoke.ca/data/ ... things are heating up.
it's gonna be a hot one


We are sending huge congratulations to @gfiske.bsky.social whose maps highlighting Arctic change will be displayed in an iconic mural location in Telluride, CO for an entire year. Here's a peek at the mural unveiled at Mountainfilm this week.
(📸 : Stash Wislocki)
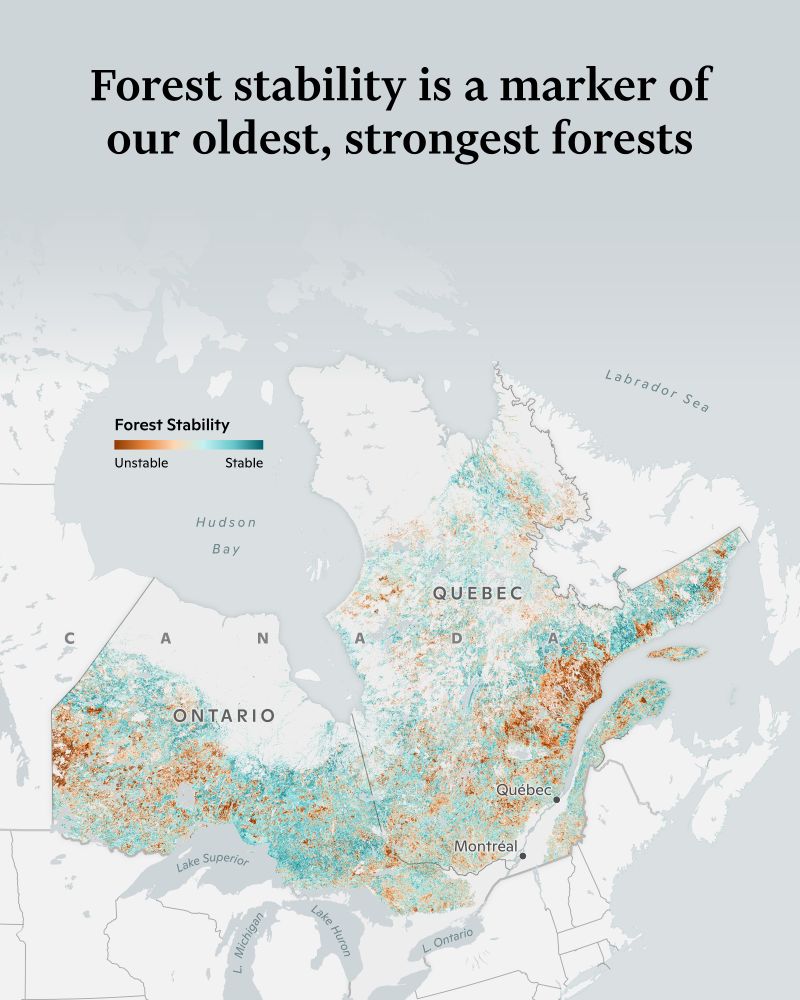
Forest stability is a measurement of a forest's resistance to disturbances, both manmade and natural. This map by @cmshintani.bsky.social shows that forest stability is a marker of our oldest, strongest forests.
Make sure to check out @mapcenter.com if you ever get the chance. Thanks Andrew for the warm welcome!
The application for the summer Cartography internship is closing this Sunday night 4/13!
![Image Description: A graphic from the Union of Concerned Scientists features a quote in white text with blue highlights on a dark, blurred background of a child receiving medical treatment. The quote reads:
"Silencing [EPA’s research office] would stifle the lifesaving health research that underlies our nation’s environmental protections, and would result in weaker regulations and higher rates of cancer, birth defects, learning disabilities, and other devastating health consequences, especially for children."
Below the quote, the author’s name, Darya Minovi, is displayed in white text, followed by her title, Senior Analyst, UCS, in blue italics. A circular photo of Darya Minovi, a smiling woman with shoulder-length dark hair, is placed on the right side of the graphic.
At the bottom, a blue button with white text reads: "READ THE BLOG POST." The Union of Concerned Scientists' logo appears in white in the lower-left corner. In the lower-right corner, a photo credit states: "Photo: ArtMarie/Getty Images © Union of Concerned Scientists 2025."](https://cdn.bsky.app/img/feed_thumbnail/plain/did:plc:rvuee746th6j5qacfrfc7jed/bafkreib2rdidpykw6rpijvbe7sr4h3nbdzq4uffdc423a6fpq7qgi7iugm)
Image Description: A graphic from the Union of Concerned Scientists features a quote in white text with blue highlights on a dark, blurred background of a child receiving medical treatment. The quote reads: "Silencing [EPA’s research office] would stifle the lifesaving health research that underlies our nation’s environmental protections, and would result in weaker regulations and higher rates of cancer, birth defects, learning disabilities, and other devastating health consequences, especially for children." Below the quote, the author’s name, Darya Minovi, is displayed in white text, followed by her title, Senior Analyst, UCS, in blue italics. A circular photo of Darya Minovi, a smiling woman with shoulder-length dark hair, is placed on the right side of the graphic. At the bottom, a blue button with white text reads: "READ THE BLOG POST." The Union of Concerned Scientists' logo appears in white in the lower-left corner. In the lower-right corner, a photo credit states: "Photo: ArtMarie/Getty Images © Union of Concerned Scientists 2025."
Who is driving the Trump administration's efforts to dismantle life-saving scientific research at the EPA? And what can you do to protect the science that upholds our nation’s environmental and public health safeguards?
Read UCS’s Darya Minovi’s blog to learn more:
➡️ act.ucsusa.org/425MoZa
Cartography summer internship alert - come make maps with me and Greg!

Woodwell Climate cartographers use maps to propel climate science for solutions. @gfiske.bsky.social and @cmshintani.bsky.social show that the act of creating maps is not just an end product, but a critical step in the scientific process.
Read more: www.woodwellclimate.org/cartography-...

Mapsdotcom (@jscarto.bsky.social) takes a peek at our CONUS Forest Carbon map led by @cmshintani.bsky.social. The map highlights research by Wayne Walker (and team) @woodwellclimate.bsky.social.
#makesciencebeautiful
www.maps.com/counting-car...


