“This is a shocking betrayal that tears out the core of American scientific prominence," said Pamitha Weerasinghe of @usacompetes.bsky.social.
To help #SaveNCAR, read our update below & visit this page, where you can find email & call scripts to share with your reps.
agu.quorum.us/campaign/151...
18.12.2025 15:36
👍 14
🔁 7
💬 0
📌 0

Save NCAR from being dismantled today!
The Trump Administration has vowed to dissolve the center that provides critical extreme weather and climate data for our nation.
The Trump Administration's plan to dismantle the @ncar-ucar.bsky.social is senseless & dangerous.
It would weaken weather forecasting, climate research, & the science that keeps people safe.
We urge that this plan be abandoned.
Call Congress to #SaveNCAR today. buff.ly/7ka1BQA
17.12.2025 19:44
👍 134
🔁 80
💬 5
📌 6

a picture of a waterfall with the words welcome to the amazon hope you brought a raincoat below it
ALT: a picture of a waterfall with the words welcome to the amazon hope you brought a raincoat below it
Interested in tropical (paleo)hydroclimate dynamics, water isotopes, and data-model comparison? Going to #AGU25? My supervisor, Alyssa Atwood, is giving an invited talk on our research into the 8.2 ka Event on Thurs., 18 Dec. between 11:40-11:50 CT! 🌊🪨🧪👩🏻💻
agu.confex.com/agu/agu25/me...
12.12.2025 23:11
👍 3
🔁 2
💬 0
📌 1
“This Is What Fascists Do”: Trump Labels Antifa a Terrorist Org in His War on Dissent https://www.democracynow.org/2025/9/24/will_potter_civil_liberties_crackdown_antifa
24.09.2025 16:21
👍 87
🔁 34
💬 3
📌 1

🧑🔬 Don't miss out on the opportunity to discover how scientists like you can use your volunteer expertise for real-world community impact. Join Thriving Earth Exchange, AGU's Community Science initiative, on August 13th at 12PM ET.
⏰ Register here: buff.ly/RecvBYP
16.07.2025 12:33
👍 4
🔁 3
💬 0
📌 0
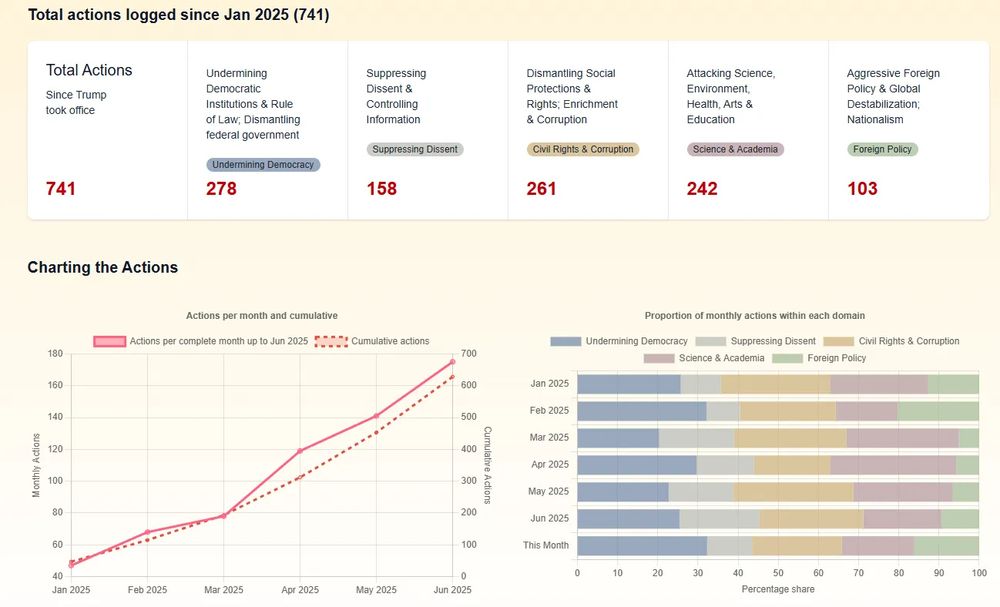
🧵Introducing the Trump Action Tracker website!
Today I’m launching www.trumpactiontracker.info - a live, searchable list of authoritarian‑style actions from Trump’s second term (over 740 actions so far). 1/14
21.07.2025 20:56
👍 2162
🔁 1154
💬 103
📌 125
This morning! @democracynow.org #ClimateCrisis #HeatExtremes #ExtremeWeather
01.07.2025 11:41
👍 25
🔁 9
💬 2
📌 1

Time series of the oceanic nino index from 1950 to 2025. Labels are shon for El Nino or La Nina conditions. There is significant variability over time.
I've added a new graphic to my climate indicators page, which shows the Oceanic Niño Index (ONI) used for monitoring El Niño/La Niña conditions. I will update it each month at zacklabe.com/climate-chan....
This graphic was thanks to a follower request. Feel free to provide suggestions any time!
28.06.2025 20:39
👍 121
🔁 34
💬 3
📌 0

Keeping Everyone's Lights On
The grid today is woefully unprepared to meet our current climate reality.
When you're living through a hurricane or extreme heat, keeping the lights can be a matter of life or death—but our power grid is woefully unprepared to meet the moment.
How do we get there?
Read our new report:
29.06.2025 15:03
👍 26
🔁 16
💬 3
📌 1
🌊
06.05.2025 15:00
👍 29
🔁 5
💬 0
📌 0
Thank you for checking in Andrea, still in shock and disbelief.
19.04.2025 16:53
👍 1
🔁 0
💬 0
📌 0

Abstract
Recent projections suggest that large geographical areas will soon experience heat and humidity exceeding limits for human thermoregulation. The survivability limits modeled in that research were based on laboratory studies suggesting that humans cannot effectively thermoregulate in wet bulb temperatures (Twb) above 26 to 31 °C, values considerably lower than the widely publicized theoretical threshold of 35 °C. The newly proposed empirical limits were derived from the Twb corresponding to the core temperature inflection point in participants exposed to stepped increases in air temperature or relative humidity in a climate-controlled chamber. Despite the increasing use of these thermal-step protocols, their validity has not been established. We used a humidity-step protocol to estimate the Twb threshold for core temperature inflection in 12 volunteers. To determine whether this threshold truly demarcates the Twb above which thermoregulation is impossible, each participant was subsequently exposed to Twb above (~33.7 °C, Tabove) and below (~30.9 °C, Tbelow) their respective inflection point (~32.3 °C, Twb) for up to 9 h (in random order). Core temperature rose continuously in Tabove. It was projected that core temperatures associated with heat stroke (40.2 °C) would occur within 10 h. While Tbelow was also uncompensable, the core temperature rate of rise was considerably lower than in Tabove such that it would take >24 h to reach 40.2 °C. Our study supports thermal-step protocols as an effective technique for evaluating survivability limits for heat exposure and provides a direct assessment of the limits of human thermoregulation.
This seems bad. Over time, what people have assumed was the physical limit of human heat tolerance keeps going down. It used to be thought it was a wet-bulb of 35C, now it seems it's more like 32C for resting humans and 27C for people doing minimal physical activity.
www.pnas.org/doi/10.1073/...
08.04.2025 20:09
👍 394
🔁 163
💬 21
📌 5

Line graph time series of 2025's daily Arctic sea ice extent compared to decadal averages from the 1980s to the 2010s. The decadal averages are shown with different colored lines with purple for the 1980s, blue for the 1990s, green for the 2000s, and white for the 2010s. Thin white lines are also shown for each year from 2000 to 2024. 2025 is shown with a thick gold line. There is a long-term decreasing trend in ice extent for every day of the year shown on this graph between January and April by looking at the decadal average line positions.
Monday ice update - #Arctic sea ice extent is currently the lowest on record (JAXA data)
• about 490,000 km² below the 2010s mean
• about 1,070,000 km² below the 2000s mean
• about 1,450,000 km² below the 1990s mean
• about 1,920,000 km² below the 1980s mean
Plots: zacklabe.com/arctic-sea-i... 🌊🧪⚒️
10.03.2025 14:01
👍 133
🔁 50
💬 3
📌 7

The Interplay of ENSO and Immunity in Infectious Disease Outbreaks - Eos
El Niño and La Niña events can affect the spread of infectious diseases including cholera and dengue fever. The effects of some diseases may persist over several years.
Extreme weather can affect the spread of diseases such as malaria, dengue fever, and cholera. New research explores how these climate patterns can interact with population immunity, affecting disease spread years after the climate event itself.
09.03.2025 17:10
👍 1
🔁 2
💬 0
📌 1

This graphic shows four line graph time series and each are monthly from January 1984 through 2025. The first graph is a 12-month running mean of global mean surface temperature anomalies. Anomalies are computed relative to a 1991-2020 baseline using ERA5 data. The second graph is monthly carbon dioxide abundance. The CO2 graph is the Keeling Curve. Current levels are 427 ppm. The third graph is monthly global methane abundance. Current levels are 1943 ppb. The fourth graph is monthly global nitrous oxide abundance. Current levels are 338 ppb. The three greenhouse gases show seasonal cycles and long-term increasing trends using data from NOAA ESRL. The global mean surface temperature anomaly record also exhibits decadal variability and a long-term increasing trend. All graphs are rising and shown in four different colors, including white, yellow, orange, and pink.
Update - my monthly climate change dashboard...
Higher resolution graphic available at zacklabe.com/climate-chan...
09.03.2025 13:40
👍 315
🔁 111
💬 11
📌 12
For the lecture on ocean circulation, I show my students this sea surface temperature simulation from NOAA/GFDL, where scientists were fired recently.
You see the major surface current systems, like the Agulhas current, Brazil current, Gulf Stream, Pacific Equatorial current, and Kuroshio current.
08.03.2025 18:03
👍 402
🔁 108
💬 12
📌 4
Happy to end my paper drought with my first postdoc paper on concurrent megadroughts in the southwestern regions of North and South America. Check it out!👇
journals.ametsoc.org/view/journal... @ametsoc.bsky.social @lamontearth.bsky.social
13.01.2025 16:10
👍 13
🔁 5
💬 0
📌 0

A positive atmospheric feedback on the North Atlantic warming hole - Scientific Reports
Scientific Reports - A positive atmospheric feedback on the North Atlantic warming hole
🌊 Why is the North Atlantic Cooling?
A @natureportfolio.bsky.social study uncovers how a cold patch in the North Atlantic - despite global warming - feeds itself by influencing wind patterns.
Could this reshape our understanding of climate change?
🔗 www.nature.com/articles/s41...
#SciComm 🧪
01.12.2024 09:05
👍 32
🔁 7
💬 2
📌 1
🌊
27.11.2024 13:26
👍 29
🔁 4
💬 0
📌 0

Award details | Funding and scholarships for students | University of Exeter
🚨PhD project in paleoclimatology🚨
Come join our friendly team to investigate:
“Tracking the biological response to the ancient South Asian monsoon: lessons from the past to inform the future”
Sediment, foraminifera, geochemistry, biology…
Pass it on!
🧪⚒️🌊🌍
www.exeter.ac.uk/study/fundin...
20.11.2024 14:11
👍 31
🔁 28
💬 1
📌 0

Research Specialist, Ocean Biogeochemical Sensing • MBARI
MBARI has a position open for a Research Specialist or Research Technician to join the Ocean Biogeochemical Sensing (OBS) Team. The ocean is facing unprecedented changes due to human activity: tempera...
🧪📍 🌊 🦑 research specialist or research technician to join the Ocean Biogeochemical Sensing team @mbarinews.bsky.social ; development and production of biogeochemical sensors for underwater gliders, profiling floats, and moorings; open until filled. Details here:
www.mbari.org/job-opening/...
26.11.2024 20:20
👍 30
🔁 15
💬 0
📌 2
For those wanting context, the Atlantic meridional overturning circulation (AMOC) keeps Europe relatively warm compared to places of similar latitude (eg northern Canada). If AMOC shuts down due to climate change the UK would rapidly become 5-15C *colder*. Obviously we are not well prepared for this
19.11.2024 22:59
👍 28
🔁 15
💬 3
📌 1

🌊🇦🇶Yichang Liu modelling the Shackleton Denman ice sheet to determine the basal melting of the ice by ocean circulation underneath. See paper by Liu et al 2024
19.11.2024 00:43
👍 9
🔁 2
💬 0
📌 0
Hey, climate folk! Reef expert and scourge of successive Australian governments, @profterryhughes.bsky.social, has arrived.
Follow for outraged updates on the Great Barrier Reef and coral bleaching from an "art lover in the Louvre as it burns".
FYI @ketanjoshi.co @katharinehayhoe.com
15.11.2024 01:07
👍 8
🔁 4
💬 0
📌 0
People are gonna look back in a few decades and wish for the climate we have today. 🥹
11.11.2024 17:27
👍 265
🔁 73
💬 6
📌 1