LinkedIn
This link will take you to a page that’s not on LinkedIn
Also, we’re hosting an event this afternoon to share how researchers can access and apply our datasets—and to spotlight our Open Ocean Research Grants Program:
🔗 lnkd.in/gSrKySCw
05.06.2025 08:47
👍 0
🔁 0
💬 0
📌 0
LinkedIn
This link will take you to a page that’s not on LinkedIn
🌊 I’m really enjoying the One Ocean Science Congress in Nice, France this week, in the lead-up to the UN Ocean Conference next week.
If you’re in Nice and interested in using Global Fishing Watch data or tools, feel free to reach out!
05.06.2025 08:46
👍 2
🔁 0
💬 1
📌 0
Just under one month left to apply for a grant through the Open Ocean Research Grant Program!
20.05.2025 21:43
👍 2
🔁 0
💬 0
📌 0

Open Ocean Research Grants Program
This research grant program aims to enhance ocean governance by publicly sharing data on human activity at sea to grow our community of practice and expand and improve Global Fishing Watch datasets.
🌊 Just launched: the Open Ocean Research Grant Program!
We’re offering up to $10k for individuals and $20k for teams using our data to tackle key ocean research questions.
Independent researchers & small teams welcome.
🔗 Apply: bit.ly/open-ocean-r...
#OceanScience #Fisheries #ResearchFunding
08.05.2025 17:25
👍 6
🔁 4
💬 1
📌 1
That's a great question, and one I think we can probably answer in the next year or so.
I think the answers are "a meaningful amount" and "yes."
04.04.2025 18:53
👍 0
🔁 0
💬 0
📌 0
Data Download Portal
You can also download the CSVs here: globalfishingwatch.org/data-download/
13.03.2025 19:21
👍 0
🔁 0
💬 0
📌 0
Here is the BigQuery query to get this public data:
SELECT
date_diff(date, "2012-01-01", day) days,
floor(cell_ll_lat*4) lat_index,
sum(fishing_hours) fishing_hours
FROM
`global-fishing-watch.fishing_effort_v3.fleet_daily_100_v3`
where
fishing_hours > 0
group
by days, lat_index
13.03.2025 19:21
👍 1
🔁 0
💬 1
📌 0

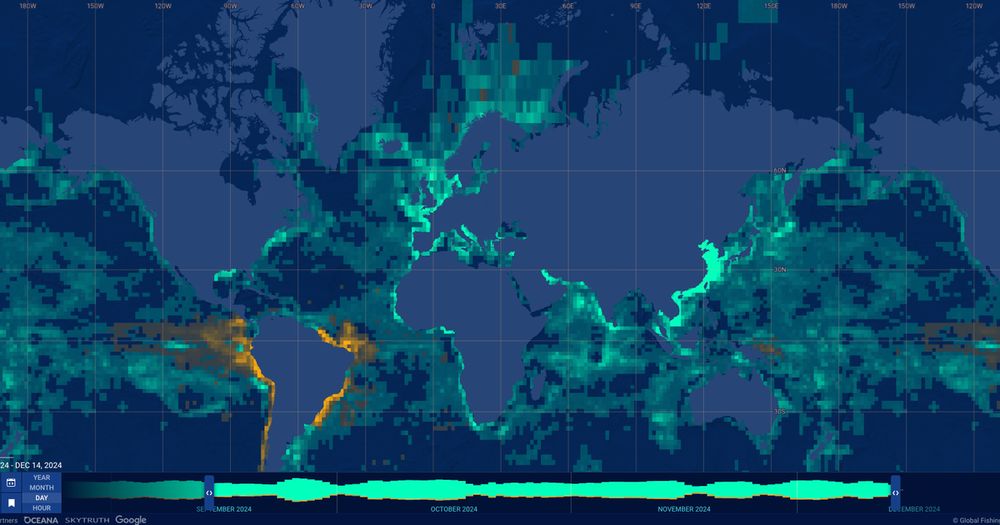
We have just updated our public fishing activity data. You can now download data for 2012-2024! Learn more: globalfishingwatch.org/insights/ask...
Here is fishing effort by latitude and day, across 12 years.
13.03.2025 16:41
👍 5
🔁 2
💬 1
📌 0

Currently on a flight to Tokyo -- amazed to have wifi over the middle of the Pacific (even if it is slow).
Looking forward to meetings in Tokyo, then Taiwan, then Korea, over the next eight days.
Here's an image of fishing from AIS data in the region.
19.02.2025 01:39
👍 4
🔁 0
💬 0
📌 0
This is all vessels. And using imagery (sar or optical) up there is going to be horribly difficult because the density of vessels is low and the density of icebergs is high.
23.01.2025 15:11
👍 4
🔁 0
💬 0
📌 0
At some point I will get around to making this for more years than just 2019.
23.01.2025 15:09
👍 4
🔁 0
💬 0
📌 0
Yeah, that’s didn’t realize that either until I made the map. You can also see how critical those rivers in northern Russia must be for transportation—but only for half the year!
23.01.2025 15:08
👍 4
🔁 0
💬 1
📌 0
arctic 2019 Apple Devices HD Best Quality
YouTube video by David Kroodsma
One year of vessel traffic in the Arctic, animated with sea ice. www.youtube.com/watch?v=Sw_f...
23.01.2025 06:09
👍 7
🔁 2
💬 2
📌 0
Our paper in Annual Review of Marine Science, "Improving Ocean Management Using Insights from Space," is now open access: www.annualreviews.org/content/jour...
23.01.2025 05:54
👍 8
🔁 0
💬 0
📌 0
Nice! It is great to see this.
15.01.2025 23:51
👍 3
🔁 0
💬 0
📌 0
It has been almost three and a half years since Caldor, and given the three "mild" fire seasons since then, it's amazing how quickly I have forgotten about the risk posed by the forests behind my neighborhood. LA is reminding me.
10.01.2025 04:55
👍 2
🔁 0
💬 0
📌 0
Seeing friends and colleagues abandon their homes and flee the smoke and fire is bringing back painful memories of when we had to evacuate for the Caldor fire in 2021. It feels like no one is safe. Thinking of everyone in LA.
10.01.2025 04:55
👍 6
🔁 0
💬 1
📌 0
And because very extra 0.1 degree of warming is worse than the one before it, it is actually more important, not less.
10.01.2025 00:46
👍 3
🔁 0
💬 0
📌 0
We are currently trying to come up with a name for this new map projection. Any suggestions? Shown is vessel activity from AIS.
09.01.2025 01:30
👍 2
🔁 0
💬 0
📌 0
If you follow us at Global Fishing Watch, be prepared to start seeing more maps with this projection :-). It is conceptually like Spilhaus, but with less distortion along the global coastline.
08.01.2025 20:52
👍 9
🔁 0
💬 1
📌 0
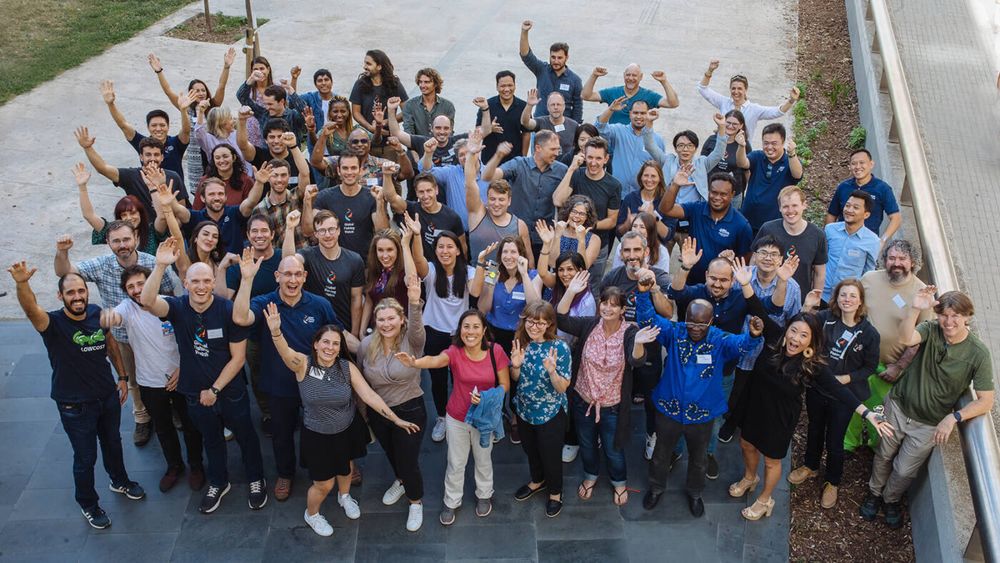
GFW team photo, Panama 2024
We are starting interviews for our new Senior Scientist, Head of Research Impact role. We have 105 candidates on the recruiting "short list", so this might take a while😅. Applications close tomorrow, so share if you know someone we should be talking to.
job-boards.greenhouse.io/globalfishin...
07.01.2025 18:58
👍 5
🔁 2
💬 0
📌 0
Two weeks ago I said "hey we should use this crazy new map projection" and today there is python code! Showing here global vessel presence density (from AIS) using the spilhaus projection in a single view where you can see the whole ocean.
07.01.2025 16:51
👍 42
🔁 13
💬 2
📌 1

I have a new analysis over at The Climate Brink exploring how rates of warming have changed over the past century.
Post-1970, GHGs (CO2, CH4, etc.) would have led to just under 0.2C per decade, but falling aerosols (SO2) have increased that rate to 0.25C. www.theclimatebrink....
06.01.2025 16:29
👍 459
🔁 180
💬 21
📌 14
Embedding data ethics at Global Fishing Watch
Learn more about our work with Global Fishing Watch.
Very happy with the work we are doing with @odihq.bsky.social to develop a robust data ethics practice to complement our use of AI, especially as we evolve to detecting smaller and smaller vessels.
Read more in the ODI blog
17.12.2024 16:22
👍 7
🔁 2
💬 1
📌 0
With South Asia (which might be more than Europe once we include vessels without AIS) being at the bottom.
03.01.2025 20:37
👍 0
🔁 0
💬 0
📌 0
I think I like having the two areas of most intense vessel traffic -- Europe and East Asia -- on opposite sides of the map.
03.01.2025 20:37
👍 0
🔁 0
💬 1
📌 0
And here's elastic-2 with AIS data: bsky.app/profile/tim....
03.01.2025 20:34
👍 1
🔁 0
💬 0
📌 0


