Public Policy
Public Policy @ UCD Geary
⚡️Dynamic electricity pricing is coming to Ireland 🇮🇪 But how can we make it effective and fair?
Our NexSys Policy Paper looks at the potential benefits and the policy actions needed to make it work.
📘 Read here: publicpolicy.ie/environment/...
#DynamicPricing #Electricity #EnergyTransition
14.10.2025 11:45
👍 2
🔁 0
💬 0
📌 0

The image displays a line graph illustrating the growth of nuclear electricity generation in France from 1970 to 2024, measured in terawatt-hours (TWh). The vertical axis, ranging from 0 to 500 TWh, indicates the amount of electricity generated, while the horizontal axis represents the years.
Starting from near zero in 1970, the curve rises steeply, particularly in the 1980s, reflecting the rapid expansion of nuclear power. Key annotations highlight that the first commercial reactor was opened in 1964, and by 1980, nuclear generation was at 60 TWh. By 1990, this figure exceeded 300 TWh.
The graph shows a general upward trend until 1999, with no new plants added until the anticipated opening of the Flamanville plant in 2024. After peaking, the curve indicates a decline in generation towards the end of the period shown.
The data source is the Energy Institute and the Statistical Review of World Energy, published in 2025. The image is credited under the Creative Commons BY license.
France opened a flurry of nuclear power plants in the 1980s and 1990s, giving it low-carbon electricity ever since—
01.10.2025 12:21
👍 57
🔁 12
💬 4
📌 3

👚 Clothing sales doubled between 2000 and 2015, while utilisation – the number of times we wear an item before discarding it – fell.
This #LondonFashionWeek has seen the return of fast fashion giant H&M.
🔎 Read Elaine Ritch on the true costs of fast fashion buff.ly/16GlEkC 👈
22.09.2025 13:49
👍 2
🔁 2
💬 1
📌 0

⚡️Is the UK falling behind on renewable energy?
In 2023, only 14.9% of UK energy consumption came from renewables.
Today’s #ChartOfTheDay looks at how EU nations are faring in the renewables transition. While Scandinavian countries surge ahead, Belgium, Luxembourg and the UK lag behind.
11.08.2025 12:47
👍 1
🔁 1
💬 1
📌 0
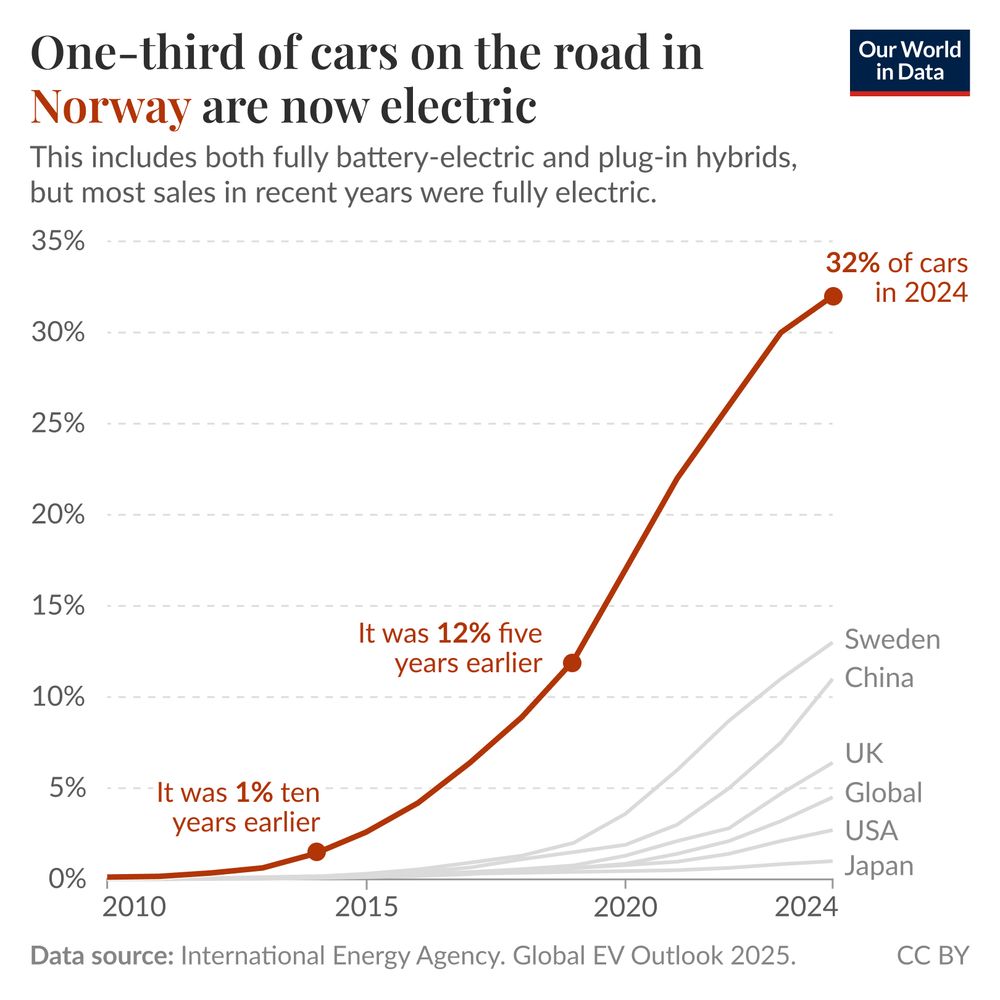
Chart showing the percentage of cars on the road in Norway (and several other countries) that are electric (includes both fully battery-electric and plug-in hybrids), from 2010 to 2024. In Norway one-third of cars are now electric, more than any other country. Data Source: International Energy Agency (2025). Chart CC BY Our World in Data
One-third of cars on the road in Norway are now electric
18.07.2025 11:50
👍 128
🔁 28
💬 1
📌 3


⚡️👨🏫 Great to present on the Irish wholesale electricity market at the @eaere.bsky.social annual conference in Bergen today. Grateful for the engaged audience and insightful discussion! #EAERE2025 #EnergyEconomics
19.06.2025 14:42
👍 5
🔁 0
💬 0
📌 0
This is the first of my PhD thesis chapters to be published, sincere thanks to my supervisors Radek Stefanski and @davidajaeger.bsky.social for their invaluable guidance and support
16.06.2025 08:14
👍 3
🔁 0
💬 1
📌 0

10 Ways You Can Help Save The Oceans | Oceana
Oceans cover more than 70% of the planet and are home to important species and ecosystems. Learn about 10 ways you can help save the oceans!
READ: Saving the oceans can sometimes feel like an overwhelming task, but if we all pitch in, we can make a big difference.
While there are countless ways you can make a difference, here are our top 10 ways you can help save the oceans 👉 oceana.ly/45JLS6p #WorldOceansDay
08.06.2025 20:53
👍 24
🔁 14
💬 0
📌 1
Progress can sometimes be slow, but with persistence it is possible. Take the case of leaded gasoline.
04.06.2025 11:20
👍 83
🔁 16
💬 2
📌 0


Had a brilliant time speaking at Pint of Science in Dublin! 🍺🔬
Thanks to @pintofscienceie.bsky.social and to everyone who came out to explore Brexit, energy and transport emissions over a pint. Looking forward to more conversations like this!
#Pint25 #Brexit #emissions #NexSys
03.06.2025 18:51
👍 3
🔁 0
💬 0
📌 0

🍺🔬 I’m speaking at @pintofscienceie.bsky.social 2025! Join me on Monday 19 May for a look at how Brexit affected shipping routes and what this means for carbon emissions 🌎🚢
📍 The Storyteller, Dublin
🎟️ Free tickets: pintofscience.ie/event/greene...
#pint25 @ucddublin.bsky.social
16.05.2025 09:26
👍 6
🔁 2
💬 0
📌 0

Data centres tend to cluster together, often around cities. This can lead to bottlenecks in local grids.
They’re also growing in size. The largest data centre under construction will use 20X more electricity as a typical hyperscale data centre today 👉 iea.li/4j2r9P3
14.04.2025 10:15
👍 6
🔁 1
💬 0
📌 1
Thanks @davidajaeger.bsky.social and @scoteconsociety.bsky.social for organising another great conference!
09.04.2025 14:10
👍 1
🔁 0
💬 0
📌 0


Presented at #SES25 in Glasgow this week! My paper with Radek Stefanski explores the Environmental Kuznets Curve through the lens of structural transformation. Great conversations and insights on global energy transitions, thanks @scoteconsociety.bsky.social for having me!
09.04.2025 13:03
👍 2
🔁 0
💬 0
📌 0


