The Keeling Curve's Avatar

The Keeling Curve

@keelingcurve

Official daily update on atmospheric CO2 levels in the post-400 ppm era from Scripps Institution of Oceanography's iconic Keeling Curve.

3,530
Followers
292
Following
648
Posts
04.04.2024
Joined
Posts Following

Latest posts by The Keeling Curve @keelingcurve

Preview
The Keeling Curve The Keeling Curve is a daily record of global atmospheric carbon dioxide concentration maintained by Scripps Institution of Oceanography at UC San Diego.

429.01 parts per million (ppm) CO2 in air 04-Mar-2026
keelingcurve.ucsd.edu

05.03.2026 18:52 ๐Ÿ‘ 12 ๐Ÿ” 6 ๐Ÿ’ฌ 0 ๐Ÿ“Œ 0
Preview
The Keeling Curve The Keeling Curve is a daily record of global atmospheric carbon dioxide concentration maintained by Scripps Institution of Oceanography at UC San Diego.

429.39 parts per million (ppm) CO2 in air 03-Mar-2026
keelingcurve.ucsd.edu

04.03.2026 18:59 ๐Ÿ‘ 16 ๐Ÿ” 10 ๐Ÿ’ฌ 0 ๐Ÿ“Œ 0
https://keelingcurve.ucsd.edu/

429.00 parts per million (ppm) CO2 in air 02-Mar-2026

03.03.2026 23:56 ๐Ÿ‘ 8 ๐Ÿ” 8 ๐Ÿ’ฌ 0 ๐Ÿ“Œ 0
Preview
The Keeling Curve The Keeling Curve is a daily record of global atmospheric carbon dioxide concentration maintained by Scripps Institution of Oceanography at UC San Diego.

429.49 parts per million (ppm) CO2 in air 28-Feb-2026
keelingcurve.ucsd.edu

02.03.2026 02:55 ๐Ÿ‘ 16 ๐Ÿ” 8 ๐Ÿ’ฌ 0 ๐Ÿ“Œ 0

429.36 parts per million (ppm) CO2 in air 27-Feb-2026
keelingcurve.ucsd.edu

28.02.2026 17:07 ๐Ÿ‘ 14 ๐Ÿ” 7 ๐Ÿ’ฌ 0 ๐Ÿ“Œ 0
Preview
The Keeling Curve The Keeling Curve is a daily record of global atmospheric carbon dioxide concentration maintained by Scripps Institution of Oceanography at UC San Diego.

430.45 parts per million (ppm) CO2 in air 25-Feb-2026
keelingcurve.ucsd.edu

26.02.2026 19:14 ๐Ÿ‘ 15 ๐Ÿ” 11 ๐Ÿ’ฌ 1 ๐Ÿ“Œ 2
Preview
The Keeling Curve The Keeling Curve is a daily record of global atmospheric carbon dioxide concentration maintained by Scripps Institution of Oceanography at UC San Diego.

429.82 parts per million (ppm) CO2 in air 23-Feb-2026
keelingcurve.ucsd.edu

24.02.2026 20:36 ๐Ÿ‘ 16 ๐Ÿ” 5 ๐Ÿ’ฌ 0 ๐Ÿ“Œ 1
Preview
The Keeling Curve The Keeling Curve is a daily record of global atmospheric carbon dioxide concentration maintained by Scripps Institution of Oceanography at UC San Diego.

430.48 parts per million (ppm) CO2 in air 22-Feb-2026
keelingcurve.ucsd.edu

23.02.2026 17:11 ๐Ÿ‘ 21 ๐Ÿ” 13 ๐Ÿ’ฌ 1 ๐Ÿ“Œ 4
Preview
The Keeling Curve The Keeling Curve is a daily record of global atmospheric carbon dioxide concentration maintained by Scripps Institution of Oceanography at UC San Diego.

Baseline reading not available, data too variable 21-Feb-2026
keelingcurve.ucsd.edu

23.02.2026 02:02 ๐Ÿ‘ 12 ๐Ÿ” 3 ๐Ÿ’ฌ 0 ๐Ÿ“Œ 0
Preview
The Keeling Curve The Keeling Curve is a daily record of global atmospheric carbon dioxide concentration maintained by Scripps Institution of Oceanography at UC San Diego.

429.95 parts per million (ppm) CO2 in air 20-Feb-2026
keelingcurve.ucsd.edu

21.02.2026 18:52 ๐Ÿ‘ 20 ๐Ÿ” 11 ๐Ÿ’ฌ 0 ๐Ÿ“Œ 1
Preview
The Keeling Curve The Keeling Curve is a daily record of global atmospheric carbon dioxide concentration maintained by Scripps Institution of Oceanography at UC San Diego.

429.73 parts per million (ppm) CO2 in air 19-Feb-2026
keelingcurve.ucsd.edu

20.02.2026 18:22 ๐Ÿ‘ 18 ๐Ÿ” 12 ๐Ÿ’ฌ 0 ๐Ÿ“Œ 1
Preview
The Keeling Curve The Keeling Curve is a daily record of global atmospheric carbon dioxide concentration maintained by Scripps Institution of Oceanography at UC San Diego.

429.89 parts per million (ppm) CO2 in air 18-Feb-2026
keelingcurve.ucsd.edu

19.02.2026 17:11 ๐Ÿ‘ 14 ๐Ÿ” 8 ๐Ÿ’ฌ 0 ๐Ÿ“Œ 0
Preview
The Keeling Curve The Keeling Curve is a daily record of global atmospheric carbon dioxide concentration maintained by Scripps Institution of Oceanography at UC San Diego.

429.12 parts per million (ppm) CO2 in air 16-Feb-2026
keelingcurve.ucsd.edu

17.02.2026 17:36 ๐Ÿ‘ 14 ๐Ÿ” 9 ๐Ÿ’ฌ 0 ๐Ÿ“Œ 0
Preview
The Keeling Curve The Keeling Curve is a daily record of global atmospheric carbon dioxide concentration maintained by Scripps Institution of Oceanography at UC San Diego.

428.90 parts per million (ppm) CO2 in air 15-Feb-2026
keelingcurve.ucsd.edu

16.02.2026 20:48 ๐Ÿ‘ 18 ๐Ÿ” 8 ๐Ÿ’ฌ 0 ๐Ÿ“Œ 0
Preview
The Keeling Curve The Keeling Curve is a daily record of global atmospheric carbon dioxide concentration maintained by Scripps Institution of Oceanography at UC San Diego.

429.02 parts per million (ppm) CO2 in air 14-Feb-2026
keelingcurve.ucsd.edu

15.02.2026 17:26 ๐Ÿ‘ 16 ๐Ÿ” 12 ๐Ÿ’ฌ 0 ๐Ÿ“Œ 2
Preview
The Keeling Curve The Keeling Curve is a daily record of global atmospheric carbon dioxide concentration maintained by Scripps Institution of Oceanography at UC San Diego.

Baseline reading not available, data too variable 13-Feb-2026
keelingcurve.ucsd.edu

14.02.2026 19:06 ๐Ÿ‘ 8 ๐Ÿ” 3 ๐Ÿ’ฌ 0 ๐Ÿ“Œ 0
Preview
The Keeling Curve The Keeling Curve is a daily record of global atmospheric carbon dioxide concentration maintained by Scripps Institution of Oceanography at UC San Diego.

Communication down 10-Feb-2026 keelingcurve.ucsd.edu

11.02.2026 22:24 ๐Ÿ‘ 8 ๐Ÿ” 2 ๐Ÿ’ฌ 0 ๐Ÿ“Œ 0
Preview
Mauna Loa carbon dioxide forecast for 2026 Atmospheric CO2 to continue to rise too fast to track IPCC 1.5ยฐC scenarios in 2026

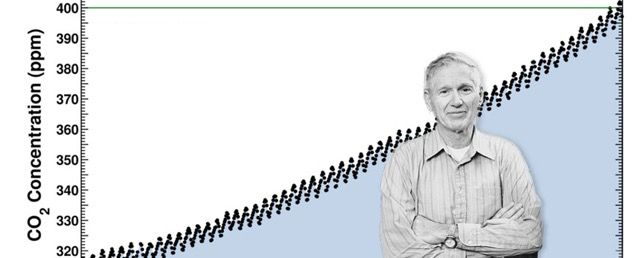
The increase in atmospheric CO2 at Mauna Loa is forecast to remain too fast to track scenarios that limit global warming to 1.5ยฐC in 2026

Find out more โฌ‡๏ธ

05.02.2026 12:30 ๐Ÿ‘ 35 ๐Ÿ” 16 ๐Ÿ’ฌ 1 ๐Ÿ“Œ 3
Preview
The Keeling Curve The Keeling Curve is a daily record of global atmospheric carbon dioxide concentration maintained by Scripps Institution of Oceanography at UC San Diego.

429.19 parts per million (ppm) CO2 in air 08-Feb-2026
keelingcurve.ucsd.edu

09.02.2026 17:15 ๐Ÿ‘ 14 ๐Ÿ” 11 ๐Ÿ’ฌ 0 ๐Ÿ“Œ 1
Preview
The Keeling Curve The Keeling Curve is a daily record of global atmospheric carbon dioxide concentration maintained by Scripps Institution of Oceanography at UC San Diego.

428.39 parts per million (ppm) CO2 in air 07-Feb-2026
keelingcurve.ucsd.edu

08.02.2026 18:56 ๐Ÿ‘ 14 ๐Ÿ” 10 ๐Ÿ’ฌ 0 ๐Ÿ“Œ 0

Baseline reading not available, data too variable 06-Feb-2026
keelingcurve.ucsd.edu

07.02.2026 17:07 ๐Ÿ‘ 6 ๐Ÿ” 1 ๐Ÿ’ฌ 0 ๐Ÿ“Œ 0
Preview
The Keeling Curve The Keeling Curve is a daily record of global atmospheric carbon dioxide concentration maintained by Scripps Institution of Oceanography at UC San Diego.

427.37 parts per million (ppm) CO2 in air 05-Feb-2026
keelingcurve.ucsd.edu

06.02.2026 21:52 ๐Ÿ‘ 12 ๐Ÿ” 8 ๐Ÿ’ฌ 0 ๐Ÿ“Œ 0
Preview
The Keeling Curve The Keeling Curve is a daily record of global atmospheric carbon dioxide concentration maintained by Scripps Institution of Oceanography at UC San Diego.

428.48 parts per million (ppm) CO2 in air 04-Feb-2026
keelingcurve.ucsd.edu

05.02.2026 18:20 ๐Ÿ‘ 11 ๐Ÿ” 4 ๐Ÿ’ฌ 0 ๐Ÿ“Œ 1
Preview
The Keeling Curve The Keeling Curve is a daily record of global atmospheric carbon dioxide concentration maintained by Scripps Institution of Oceanography at UC San Diego.

428.29 parts per million (ppm) CO2 in air 03-Feb-2026
keelingcurve.ucsd.edu

05.02.2026 00:40 ๐Ÿ‘ 16 ๐Ÿ” 10 ๐Ÿ’ฌ 0 ๐Ÿ“Œ 0
Preview
The Keeling Curve The Keeling Curve is a daily record of global atmospheric carbon dioxide concentration maintained by Scripps Institution of Oceanography at UC San Diego.

427.83 parts per million (ppm) CO2 in air 02-Feb-2026
keelingcurve.ucsd.edu

03.02.2026 22:57 ๐Ÿ‘ 14 ๐Ÿ” 7 ๐Ÿ’ฌ 0 ๐Ÿ“Œ 0
Preview
The Keeling Curve The Keeling Curve is a daily record of global atmospheric carbon dioxide concentration maintained by Scripps Institution of Oceanography at UC San Diego.

427.76 parts per million (ppm) CO2 in air 01-Feb-2026
keelingcurve.ucsd.edu

02.02.2026 17:23 ๐Ÿ‘ 10 ๐Ÿ” 7 ๐Ÿ’ฌ 0 ๐Ÿ“Œ 0
Preview
The Keeling Curve The Keeling Curve is a daily record of global atmospheric carbon dioxide concentration maintained by Scripps Institution of Oceanography at UC San Diego.

427.97 parts per million (ppm) CO2 in air 31-Jan-2026
keelingcurve.ucsd.edu

01.02.2026 18:02 ๐Ÿ‘ 25 ๐Ÿ” 11 ๐Ÿ’ฌ 0 ๐Ÿ“Œ 2
Preview
The Keeling Curve The Keeling Curve is a daily record of global atmospheric carbon dioxide concentration maintained by Scripps Institution of Oceanography at UC San Diego.

427.99 parts per million (ppm) CO2 in air 30-Jan-2026
keelingcurve.ucsd.edu

31.01.2026 17:15 ๐Ÿ‘ 16 ๐Ÿ” 6 ๐Ÿ’ฌ 0 ๐Ÿ“Œ 0
Preview
The Keeling Curve The Keeling Curve is a daily record of global atmospheric carbon dioxide concentration maintained by Scripps Institution of Oceanography at UC San Diego.

427.90 parts per million (ppm) CO2 in air 29-Jan-2026
keelingcurve.ucsd.edu

30.01.2026 17:18 ๐Ÿ‘ 10 ๐Ÿ” 4 ๐Ÿ’ฌ 0 ๐Ÿ“Œ 0
Preview
The Keeling Curve The Keeling Curve is a daily record of global atmospheric carbon dioxide concentration maintained by Scripps Institution of Oceanography at UC San Diego.

427.82 parts per million (ppm) CO2 in air 28-Jan-2026
keelingcurve.ucsd.edu

29.01.2026 17:14 ๐Ÿ‘ 10 ๐Ÿ” 5 ๐Ÿ’ฌ 0 ๐Ÿ“Œ 0