In my latest article, I break down the Philox RNG, which is a counter-based RNG along with its implementation inside PyTorch.
Read it here: blog.codingconfessions.com/p/how-pytorc...
22.12.2025 12:27
👍 0
🔁 0
💬 0
📌 0
Traditional RNGs, such as Mersenne Twister are hard to parallelize and my mental model was still stuck in that era. However, turns out systems like PyTorch use more modern techniques that are embarrasingly parallel.
22.12.2025 12:27
👍 0
🔁 0
💬 1
📌 0

I recently explored how DL frameworks leverage the parallel cores in the GPU to generate random numbers in parallel.
22.12.2025 12:27
👍 1
🔁 0
💬 1
📌 0

What Makes System Calls Expensive: A Linux Internals Deep Dive
An explanation of how Linux handles system calls on x86-64 and why they show up as expensive operations in performance profiles
In my latest article, I talk about this in detail. The article shows the Linux kernel code which handles system calls and breaks down the performance implication of each step the kernel takes.
Read it here: blog.codingconfessions.com/p/what-makes...
21.09.2025 12:47
👍 2
🔁 1
💬 0
📌 0
More importantly, they also make the user space code slow after return from the kernel, and this can be more costly. This happens due to the loss of the microarchitectural state of the process, such as instruction pipeline getting drained, branch predictor buffers getting flushed, etc.
21.09.2025 12:47
👍 0
🔁 0
💬 1
📌 0

System calls are the interface between the user space and the kernel. They are needed for fundamental things like reading a file, and making a network call. But they are also very expensive because they need to do things like saving/restoring registers, page table, stack.
21.09.2025 12:47
👍 2
🔁 1
💬 1
📌 0
Errata-2: Increased penalty on cache misses and branch misses increases the CPI (cycles per instruction) and lowers IPC.
The article has all the details correctly explained.
13.07.2025 14:22
👍 0
🔁 0
💬 0
📌 0
Errata-1: I meant to write the law as performance = 1 / (instruction count x cycles per instruction x cycle time).
13.07.2025 14:22
👍 0
🔁 0
💬 1
📌 0
In my latest article, I show this connection with the help of several common optimizations:
- loop unrolling
- function inlining
- SIMD vectorization
- branch elimination
- cache optimization
If you are someone who thinks about performance, I think you will find it worth your time.
13.07.2025 13:50
👍 0
🔁 0
💬 1
📌 0
Reasoning about microarchitectural code optimizations also works very similarly. Each optimization affects one or more of these factors:
- number of instructions executed (dynamic instruction count)
- instructions executed per cycle (IPC)
- CPU clock cycle
13.07.2025 13:50
👍 0
🔁 0
💬 1
📌 0
As an example: when increasing the depth of the instruction pipeline, CPU architects can use this law to decide how much can they increase the depth. Increasing the depth reduces the cycle time, but it indirectly increases the IPC as cache miss and branch miss penalties become more severe.
13.07.2025 13:50
👍 0
🔁 0
💬 1
📌 0
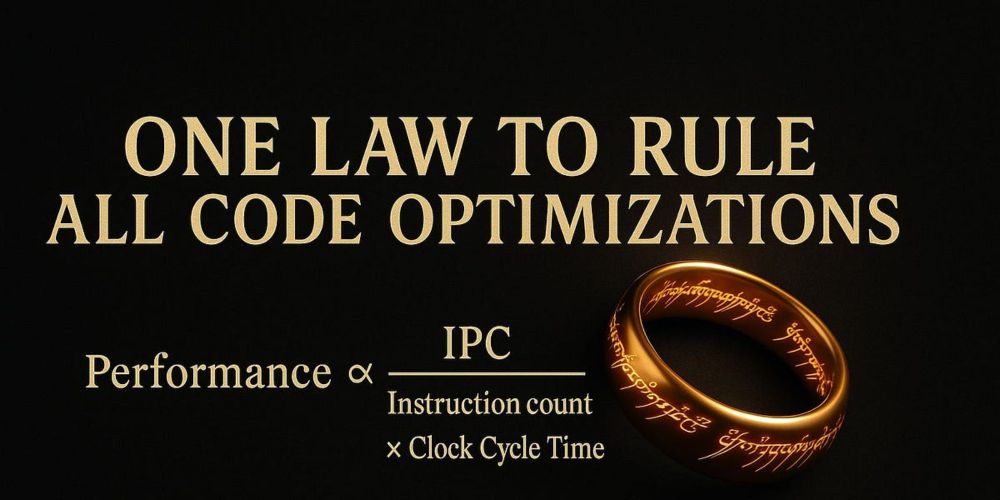
The Iron Law is used by CPU architects to analyse how a change in the CPU microarchitecture will drive the performance of the CPU.
The law defines CPU performance in terms of three factors:
Performance = 1 / (instruction count x instructions per cycle x cycle time)
13.07.2025 13:50
👍 0
🔁 0
💬 1
📌 0
This is where you wish for a theory to systematically reason about the optimizations so that you know why they work and why they don't work. A framework that turns the guesses into surgical precision.
Does something like this exist? Maybe there is: the Iron Law of performance.
13.07.2025 13:50
👍 0
🔁 0
💬 1
📌 0
People talk about profiling to find bottlenecks, but no one explains how to fix them. Many devs shoot in the dark and when the optimization backfires, they aren't sure how to proceed.
13.07.2025 13:50
👍 3
🔁 1
💬 1
📌 0
Skipping computer architecture was my biggest student mistake. Hardware’s execution model dictates memory layout, binaries, compiler output, and runtimes. If you want to build systems, learn how the CPU works. I wrote an article on this:
blog.codingconfessions.com/p/seeing-the...
21.05.2025 04:41
👍 2
🔁 1
💬 0
📌 0
If you want a more detailed explanation of what is happening here, and why the `not` operator doesn't need to do the same thing: see my article.
blog.codingconfessions.com/p/python-per...
12.04.2025 08:43
👍 1
🔁 0
💬 0
📌 0
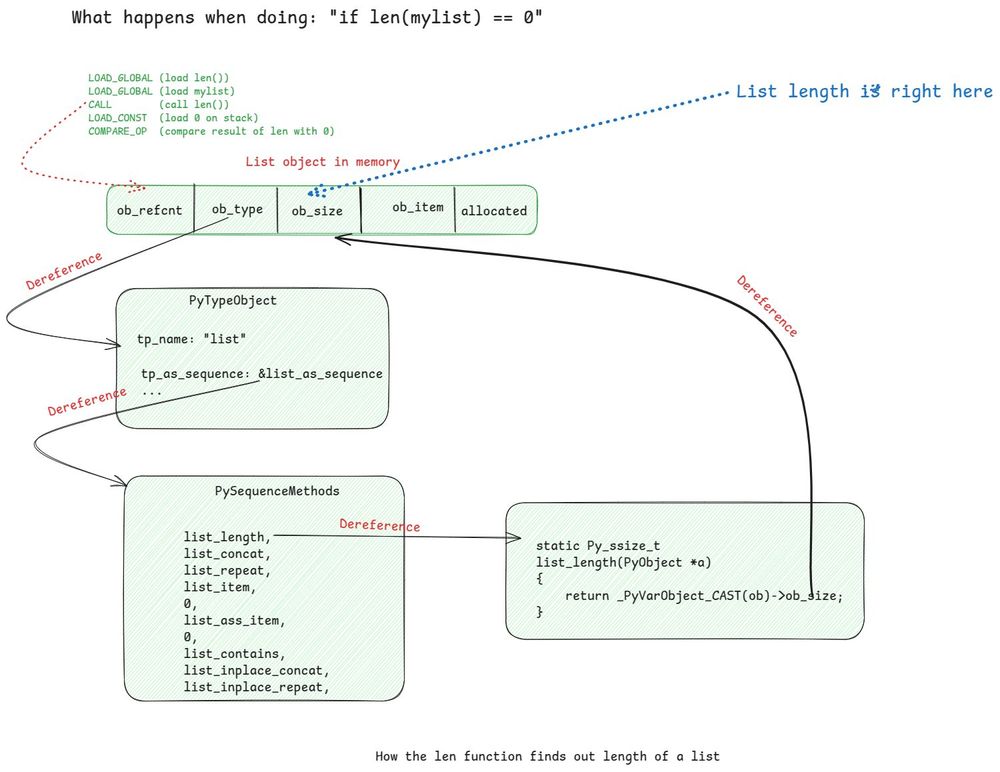
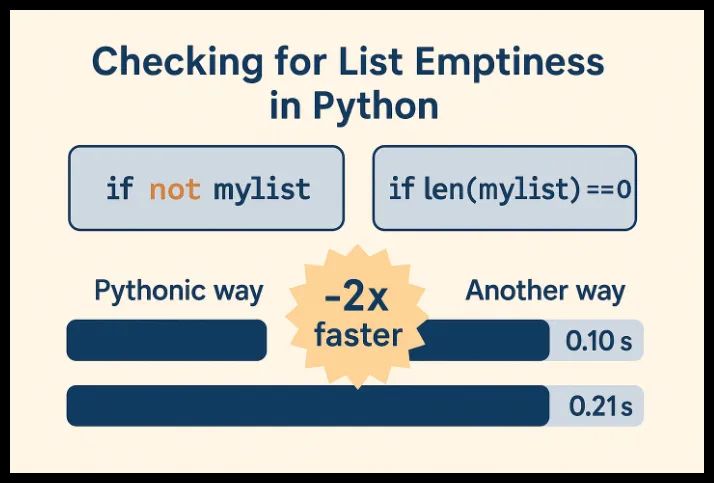
Here’s a fun visual showing how len() finds the length of a list in Python.
The size is stored right inside the object, but len() takes a five-pointer detour, only to land back where it started.
This is why if not mylist is ~2x faster for emptiness checks!
12.04.2025 08:43
👍 7
🔁 2
💬 1
📌 0

Hardware-Aware Coding: CPU Architecture Concepts Every Developer Should Know
Write faster code by understanding how it flows through your CPU
My article is written with zero assumption of any prior background in computer architecture. It uses real-world analogies to explain how the CPU works and why these features exist. And gives code examples to put all of that knowledge into action.
blog.codingconfessions.com/p/hardware-a...
28.03.2025 08:48
👍 5
🔁 0
💬 0
📌 0
A mispredicted branch usually wastes 20-30 cycles. So you don't really want to be missing branches in a critical path. For that you need to know how the branch predictors work and techniques to help it predict the branches better.
In the article you will find a couple of example on how to do that
28.03.2025 08:48
👍 1
🔁 0
💬 1
📌 0
If the prediction is right, your program finishes execution faster.
If the prediction is wrong, then the speculative work goes wasted and the CPU has to start from scratch to fetch the right set of instructions and execute them.
28.03.2025 08:48
👍 0
🔁 0
💬 1
📌 0
Waiting until that happens means the instruction pipeline is not doing anything, which wastes resources.
To avoid this wastage of time and resource the CPU employs branch predictors to predict the branch direction and speculatively execute those instructions.
28.03.2025 08:48
👍 0
🔁 0
💬 1
📌 0
Finally, branch prediction.
All real-world code is non-linear in nature, it consists of branches, such as if/else, switch case, function calls, loops, etc. The execution flow depends on the branch result and that is not known until the processor executes it.
28.03.2025 08:48
👍 0
🔁 0
💬 1
📌 0
To build a performant system, you need to write code which takes advantage of how the caches work.
In the article I explain how caches work and how can you write code to take advantage of caches to avoid the penalty of slow main memory access.
28.03.2025 08:48
👍 0
🔁 0
💬 1
📌 0
E.g. an instruction could be finish in 1 cycle but often its operands are in main memory and retrieving them from there takes hundreds of cycles. To hide this high latency, caches are used. Fetching from L1 cache takes only 3-4 cycles.
28.03.2025 08:48
👍 0
🔁 0
💬 1
📌 0
While ILP enables the hardware to execute several instructions per cycle, those instructions often are bottlenecked on memory.
28.03.2025 08:48
👍 0
🔁 0
💬 1
📌 0
But it is only possible when your code provides enough independent instructions to the hardware. Usually compilers try to optimize for it, but sometimes you need to do it yourself as well.
In the article I explain how ILP works with code examples to demonstrate how you can take advantage of it.
28.03.2025 08:48
👍 0
🔁 0
💬 1
📌 0
Instruction level parallelism (ILP) enables the processors to execute multiple instructions of your program in parallel, which results in better utilization of execution resources and faster execution of your code.
28.03.2025 08:48
👍 0
🔁 0
💬 1
📌 0
In my latest article I have described the mindset that is required to achieve this. I explain the three key architectural features of modern CPUs which is responsible for the performance of most of our code: instruction level parallelism, caches, and branch prediction.
28.03.2025 08:48
👍 0
🔁 0
💬 1
📌 0