
I forgot to mention that you can now import your REDCap audit logs. 🤓 It defaults to the past 7 days.
01.12.2025 21:07
👍 0
🔁 0
💬 0
📌 0
I forgot to mention that you can now import your REDCap audit logs. 🤓 It defaults to the past 7 days.
🦆 📦 redquack 0.3.0 now includes a suite of convenience functions, and more importantly, full control over labeling variables and coded values without separate imports.
This makes redquack a great tool for large or small REDCap projects.
➡️ dylanpieper.github.io/redquack/
#rstats #redcap
**course material for adults who swear**

Stretching DuckDB w/ Common Crawl, ~1.7B rows, ~300 parquet files. ~2-3s for single-column aggregations, ~2-3 mins to SUMMARIZE the data, peaking at ~12-14GB memory usage. Not exactly real-time, but the fact you can do this on a laptop with no server setups or Spark pipelines is still amazing.

A little known fact is that RStudio rendering is powered by users’ electromagnetic fields (i.e., “good vibes”) and the exodus to Positron has severely limited its ability to compile code. #rstats
Remember this #rstats post? I wasn't the only one talking about it & the tidyverse team was listening 😎 #databs
New #dplyr functions? They're looking for feedback!!
🤔 replace_when, recode_values, replace_values
👀 Read this:
github.com/tidyverse/ti...
🗣️ Comment on PR:
github.com/tidyverse/ti...

I think pedocon theory is right. It’s empirically adequate, parsimonious, fits within a broader theoretical framework, and has immense explanatory breadth and depth www.liberalcurrents.com/we-need-to-t...
I am such a sucker for frivolous uses of AI. Here's an anthem for the tidyverse: suno.com/s/iVMVs4IoyA...
Modules + Claude code for simple but labor intensive edits across files

Very cool to see authors of this article mentioning the importance of sharing project-, data-, AND variable-level documentation alongside data in a repository, and linking to the templates I've provided on OSF as an example! 🌟
doi.org/10.1515/ling...
Tbh I relate to that big yellow spike of with mad uncertainty around age 30. 🤣
As a data manager, good documentation not only helps me do my job better, but also helps me annoy you less! 😅
Good documentation about inclusion criteria, READMEs about oddities in the data, consort diagrams and tracking to explain missing data, and so on, are all ways to ensure I bug you less! 🐛🐜🐝
I think if you’re curious and truly care about problem solving you might have a ~temporary~ feeling of closure or a premature commit. But you will keep iterating (opening/closing) as you explore the problem space and how it works, validate the throughput, and improve the methods. Stay curious!

New to me is the term "premature closure", where you too quickly latch on to the first solution you see. Always a danger in coding, but particularly so today when LLMs can give you a plausible fix so so quickly.
www.shayon.dev/post/2025/16...
I would use cosine in stringdist. If you have lists of job descriptions (from two sources with each idx being a similar job), you can use my package samesies. dylanpieper.github.io/samesies/
So cool! Any intros or docs planned for helping people familiar with the futureverse make the leap to marai?

Bleeding edge update for the #tidyverse purrr package with even more seamless #rstats parallel maps.
Introducing our shiniest new adverb: `in_parallel()`. Just wrap your function to take advantage of blazing fast parallel processing via mirai.
pak::pak("tidyverse/purrr")
purrr.tidyverse.org/dev/
One cool thing you can/should do is sample from priors only, and plot the distribution of the actual quantity of interest (ex: risk ratio). I find this very useful. This is actually super easy with brms. arelbundock.com/posts/margin...

This blog post about engineering not doing ETL is nine years old… it’s worth reviewing
multithreaded.stitchfix.com/blog/2016/03...
The worst is when you write in active voice and then someone tries to edit all of it back into passive. Old habits die hard and the good fight continues.
You could use surveydown and provide the LLM with the package docs
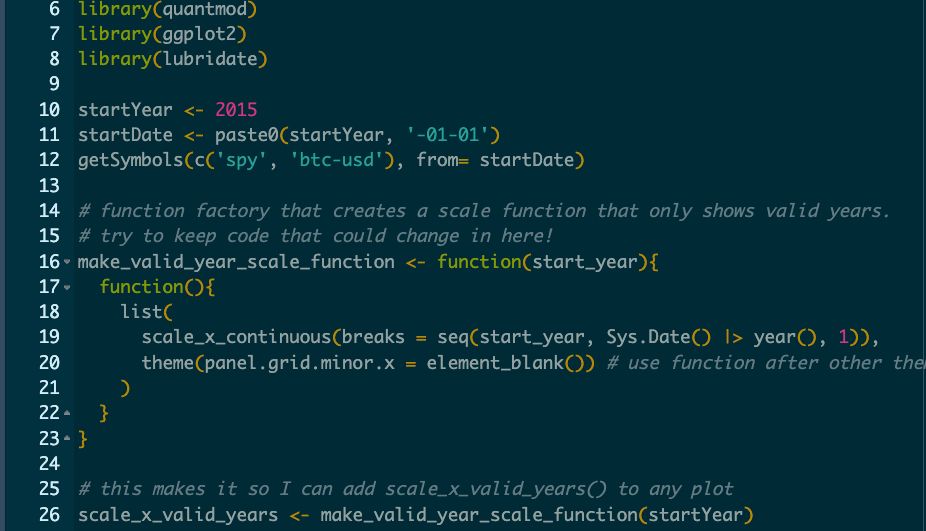
screenshot of a code editor showing the following R code: library(quantmod) library(ggplot2) library(lubridate) startYear <- 2015 startDate <- paste0(startYear, '-01-01') getSymbols(c('spy', 'btc-usd'), from= startDate) # function factory that creates a scale function that only shows valid years. # try to keep code that could change in here! make_valid_year_scale_function <- function(start_year){ function(){ list( scale_x_continuous(breaks = seq(start_year, Sys.Date() |> year(), 1)), theme(panel.grid.minor.x = element_blank()) # use function after other theme funcs ) } } # this makes it so I can add scale_x_valid_years() to any plot scale_x_valid_years <- make_valid_year_scale_function(startYear)
Here's a functional programming trick for #rstats that I wish I started using sooner:
if you need a #ggplot2 scale to be reusable across multiple plots and dynamically configurable without relying on global state, consider using a function factory (a function that returns a function) to build it

mirai - minimalist async framework for #RStats - released as an 'r-lib' package.
Blog post: Advancing Async Computing in R.
shikokuchuo.net/posts/26-mir...
mirai provides event-driven async for #RShiny and parallel processing for purrr #tidyverse.
Really excited to be working on this at Posit!

tl;dr — this EO co-opts the language of open science to implement a system of political control wherein presidential appointees are given broad latitude to designate any number of reasonable scientific activities and inferences as scientific misconduct, and to penalize those involved accordingly.
There's so much polarization around LLMs. They are way overhyped, I agree. But I also use them semi-regularly now.
Here's a thread of genuine use cases where I find them helpful. Please add your own!

📦 I’m excited to share a new #rstats package I’ve been working on: {shinyfa} built to help folks working on large or unfamiliar #rshiny apps ✨
The package scans your app folders and extracts out details on render*(), reactive() and input$ to a dataframe!
📖 www.dalyanalytics.com/blog/shinyfa...

Playing around with satellite imagery of #madison to make some office art. #Rstats
✨Use llms from #rstats with ellmer ✨Version 0.2.0 is on CRAN now. No blog post yet because I'm about to go on vacation, but in the meantime you can check out the release notes: github.com/tidyverse/el....
The kind of Friday morning content I needed to see. ❤️

Text: posit conf 2024 Virtual Tickets Available, Atlanta, September 16-18. A drawing outline of the Atlanta skyline and abstract cubes.
Registration for the posit::conf(2025) virtual experience is now open!
Join us virtually, Sept 16–18, and access live-streamed keynotes and 100+ talks, on-demand recordings, Q&A sessions, and our virtual networking platform.
Learn more in the blog post: posit.co/blog/posit-c...
#RStats #Python