

i love data, me too meme
04.03.2026 00:34
👍 185
🔁 42
💬 11
📌 11
i love data, me too meme

Here’s a full draft of the upcoming second edition of my “Data Visualization: A Practical Introduction”: socviz.co

@tiffanyxwu.bsky.social, an EPI postdoctoral fellow, was recently featured in an Education Week article on academic absenteeism.
Read the full story: https://myumi.ch/9pMwX
The Spring 2026 course website for my grad causal inference class is up and running. Was inspired by @andrew.heiss.phd and @mattblackwell.bsky.social to move my materials over to a standalone site and use as little of Canvas as possible.
www.antonstrezhnev.com/ps813/
Curious about what people said in response to the RFI about "re-imagining" the Institute of Education Sciences (IES)? I put the public comments in one file (763 pages) and used AI to analyze the themes and areas of agreement and disagreement (5 pages) by audience ⬇️: docs.google.com/document/d/1...

course schedule as a table. Available at the link in the post.
I'm teaching Statistical Rethinking again starting Jan 2026. This time with live lectures, divided into Beginner and Experienced sections. Will be a lot more work for me, but I hope much better for students.
I will record lectures & all will be found at this link: github.com/rmcelreath/s...

Just gave my last talk of the year!
2025 was quite packed, I gave talks about:
- the age-period-cohort problem
- making rigorous causal inference more mainstream
- mediation analysis
- marginaleffects
- causal graphs (x10)
If you're curious, check out my slides here: juliarohrer.com/resources/

New data from @sara-altman.bsky.social & @simonpcouch.com, using the vitals and ellmer packages, looks at LLM performance metrics for #RStats.
👀 Sneak peek: Claude Opus 4.5, Claude Sonnet 4.5, & OpenAI GPT-5 lead in generating correct R code.
Read the full breakdown: posit.co/blog/r-llm-e...

The Relationship Between Student Attendance and Achievement, Pre- and Post-COVID journals.sagepub.com/doi/abs/10.1...

We invest 9X less per child-year in care & education in the first 5 years of life than the next 13.
This gap in public investment is why K12 is free for parents & early care & education is expensive.
www.hamiltonproject.org/publication/...
🚨Interested in a PhD focusing on quant methods and education & social policy? I'm recruiting this year at @bclynchschool in the Measurement, Evaluation, Statistics, and Assessment program www.bc.edu/bc-web/schoo...

📢 #EdWorkingPapers: How can we measure student behavior at scale?
@tiffanyxwu.bsky.social, @weilanch.bsky.social, @mattadiemer.bsky.social, Rebecca Unterman, @annakshapiro.bsky.social, & Thomas Staines use PCA and factor analysis to build behavior composites from admin data.
📄 bit.ly/4ofre5b
🔥What’s the only thing hotter than this week’s weather?🔥
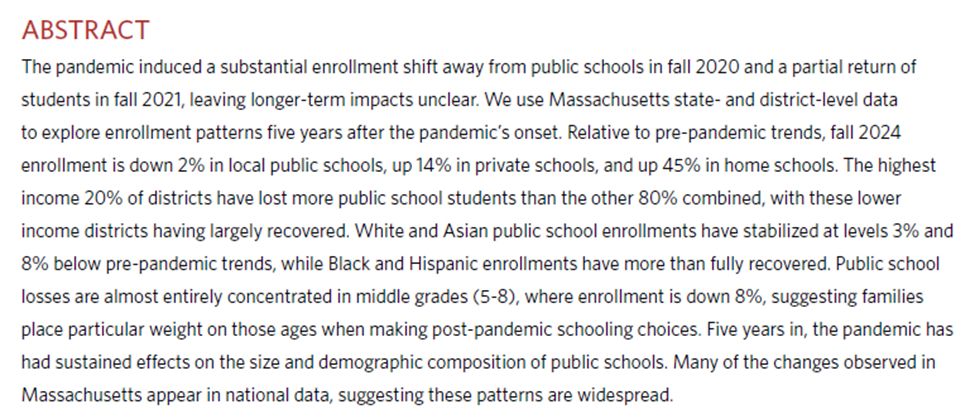
Our new @wheelockpolicybu.bsky.social working paper:
“School Enrollment Shifts Five Years After the Pandemic”
In it, BU Wheelock PhD @abbyfrancis.bsky.social and I ask:
Has the pandemic permanently changed families' schooling choices?
If we're heading into summer that means academic job market season is looming. As a reminder, my collected tips are here (along with my standing offer to set up time to chat with folks): www.paul-bruno.com/2021/07/tips...
Re-upping my advice about how to write a good title and abstract for an academic paper, appropriately called:
"How to Write a Title and Abstract"
Feel free to share this thread, which will focus on titles.
#EconSky #AcademicSky
A special thank you to Christina Claiborne, @aizatnurshat.bsky.social , and the the entire #EdWorkingPapers and #EdExchange teams at @annenberginstitute.bsky.social for featuring our study in their new series, and for creating such a valuable platform to connect research and practice!
Huge thanks to our research-practice partners at Boston Public Schools and Massachusetts Department of Education, and the team at EPI, without whom this work would not be possible.
Led by our fearless leader @weilanch.bsky.social, alongside amazing co-authors Rebecca Unterman, @annakshapiro.bsky.social, Shekinah Lightner, Thomas Staines, and Annie Taylor.
Compared to CTL group, TRT compliers were:
✅ More likely to remain enrolled in BPS throughout middle school
✅ More likely to apply to exam schools
✅ Less likely to be suspended in 7th grade
✅ More likely to complete Algebra I by the end of 8th grade
✅ Higher-performing on 7th grade math tests
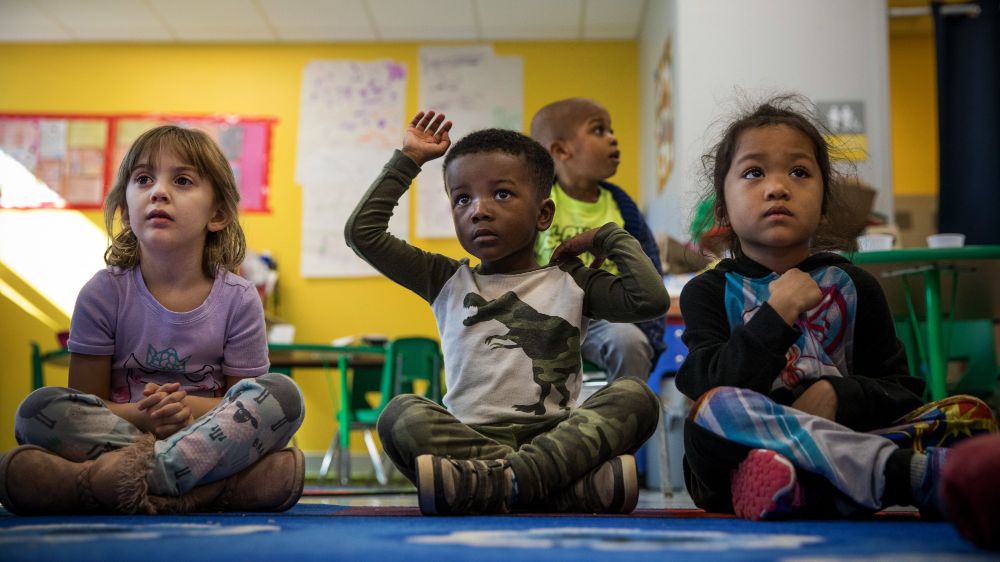
We find that winning an oversubscribed seat in one of Boston Public Schools’ (BPS) high-quality Pre-K programs shaped students’ middle school trajectories in meaningful ways, despite nearly all control group children attending other preschool programs.
📄 Don’t have time for all 86 pages?
Check out our short summary featured in the new #EdWorkingPapers Policy & Practice Series by @annenberginstitute.bsky.social, designed for education leaders and decision-makers:
🔗 edworkingpapers.com/policy-practice-series/ai25-1194

A screenshot of the abstract of the working paper

Figure 1: School Enrollment Pathways for Lottery Winners and Control Group Students through 8th Grade. This figure represents school enrollment pathways across different school types (BPS, BPS Exam School, non-BPS district school, charter school, and other) for both lottery winners and the control group. The thickness of the lines represents the percentage of lottery winners/control group students that are enrolled in each type of school. Blue lines show the pathways taken by lottery winners, and BPS-specific school categories are highlighted in the light blue boxes. BPS = Boston Public Schools.
🤔 What kind of Pre-K experience sets students up for long-term success?
Our new working paper offers important new evidence to help answer this question!
🔗 edworkingpapers.com/sites/default/files/ai25-1194.pdf
And 🧵👇
🚀 Launching the EdWorkingPapers Policy & Practice Series!
Too much good research never reaches the people making real decisions.
Our new series changes that. Each 2-pager highlights key findings from #EdWorkingPapers, made for busy leaders and policymakers.
📄 Read the first three: bit.ly/3Z1Kok2
Using data from Michigan, we find that third grade retention for struggling readers may be a much less important component of the benefits of literacy reforms than previously understood.
(Thx, @annenberginstitute.bsky.social, for the dissemination bump!)
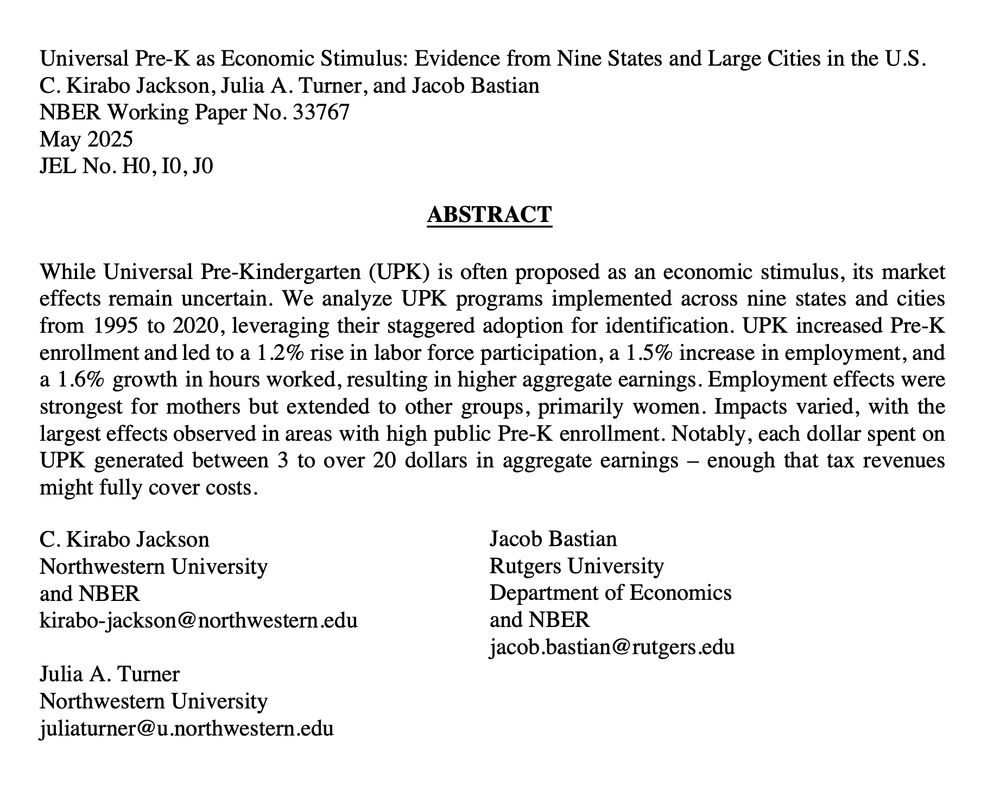
Wow!
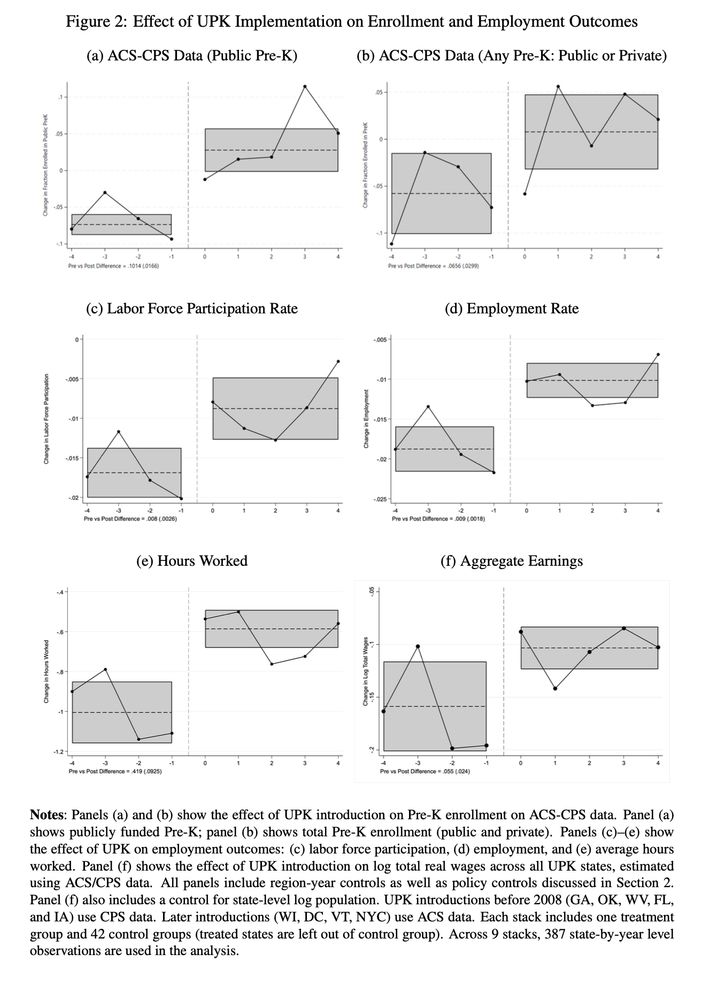
Each $1 spent on Universal Pre-Kindergarten generates between $3-$20 dollars in aggregate earnings.
That's enough to offset the costs of Universal Pre-Kindergarten through higher tax revenues.
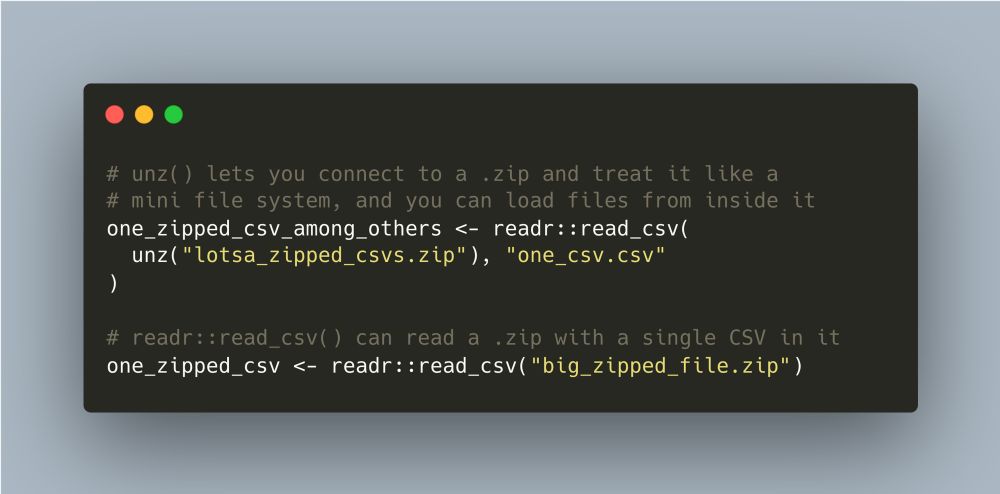
# unz() lets you connect to a .zip and treat it like a mini file system, # and you can load files from inside it one_zipped_csv_among_others <- readr::read_csv( unz("lotsa_zipped_csvs.zip"), "one_csv.csv" ) # readr::read_csv() can read a .zip with a single CSV in it one_zipped_csv <- readr::read_csv("big_zipped_file.zip")
Thing I just learned in #rstats: unz() lets you connect to a .zip and load files from inside it without actually unzipping it (great for a file I'm working with that's 30 MB zipped and 1+ GB unzipped, with multiple CSVs in it)
I hope it is not lost, in all of the chaos at the federal level, that there are many longstanding, discretionary programs that are on the Administration's chopping block, either directly or through the erosion of agency staff, expertise, and capacity. Programs enacted and reauthorized through...

Model to Meaning: How to interpret statistical models with marginaleffects for R and Python
📚😅🎉
Yay!! I just submitted the complete manuscript of my upcoming book to the publisher!
Learn to easily and clearly interpret (almost) any stats model w/ R or Python. Simple ideas, consistent workflow, powerful tools, detailed case studies.
Read it for free @ marginaleffects.com
#RStats #PyData
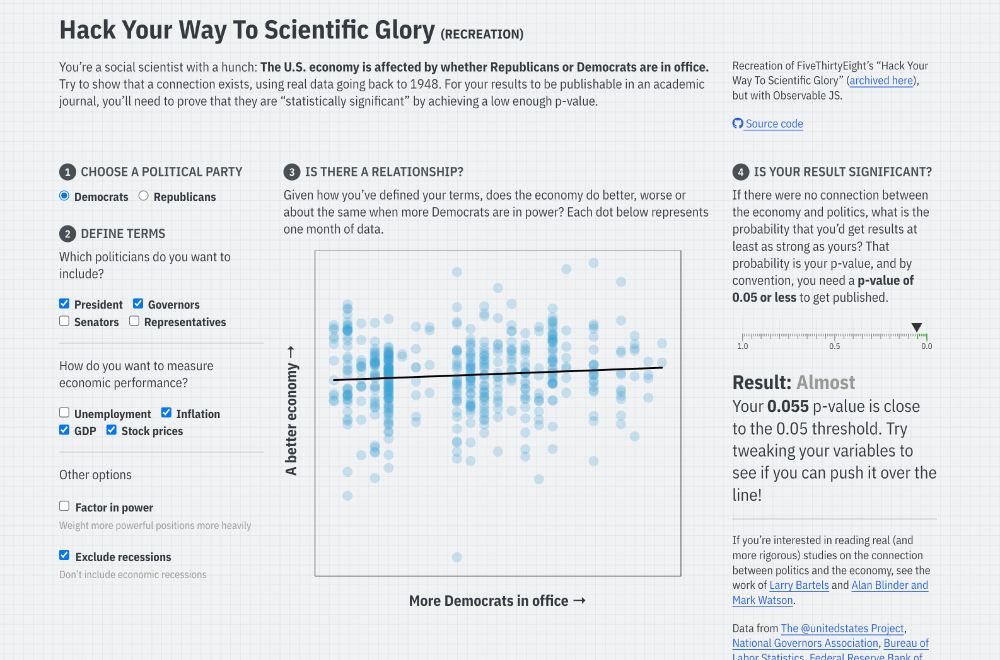
Screenshot of the linked Quarto website, with input checkboxes to change different conditions for a regression model that predicts economic performance based on US political party, with a reported p-value
I’ve long used FiveThirtyEight’s interactive “Hack Your Way To Scientific Glory” to illustrate the idea of p-hacking when I teach statistics. But ABC/Disney killed the site earlier this month :(
So I made my own with #rstats and Observable and #QuartoPub ! stats.andrewheiss.com/hack-your-way/
If you have research dependent on these data here is my suggestion
1/N
Big picture:
Create a dataset of cell means (cells must be big enough to pass disclosure)
- load these cell means into many, many tables & put through review
-These cell means can then be used in OLS - which runs on means