
Hier ist noch die Info zu der ganzen Vortragsreihe, mit super spannenden weiteren Themen: www.zfw.uni-hamburg.de/oeffentliche...
28.10.2025 08:34
👍 1
🔁 0
💬 0
📌 0

@lukasbrunner
Climate scientist @uni-hamburg.de: future projections, extremes, uncertainties | Formerly @ethz.ch @univie.ac.at | PhD @uni-graz.at | Python nerd | Hiking enthusiast #SystemChangeNotClimateChange #OpenScience More: https://lukasbrunner.github.io
Hier ist noch die Info zu der ganzen Vortragsreihe, mit super spannenden weiteren Themen: www.zfw.uni-hamburg.de/oeffentliche...

Letzte Woche durfte ich im Rahmen der Ringvorlesung zur Klimakrise der @uni-hamburg.de einen Vortrag zu den naturwissenschaftlichen Grundlagen der Klimakrise geben. Vielen Dank fürs Dabeisein und für die spannenden Fragen! Zum Nachschauen 👇
youtu.be/IuTXbtR1fFw
#SystemChangeNotClimateChange
Vielen Dank für das Interesse und die angeregte Diskussion an alle die (online) dabei waren!
Der Vortrag ist zum nachsehen jetzt auch auf YouTube 💻
Die zugehörigen Slides auf meiner Homepage: lukasbrunner.github.io/outreach
youtu.be/IuTXbtR1fFw
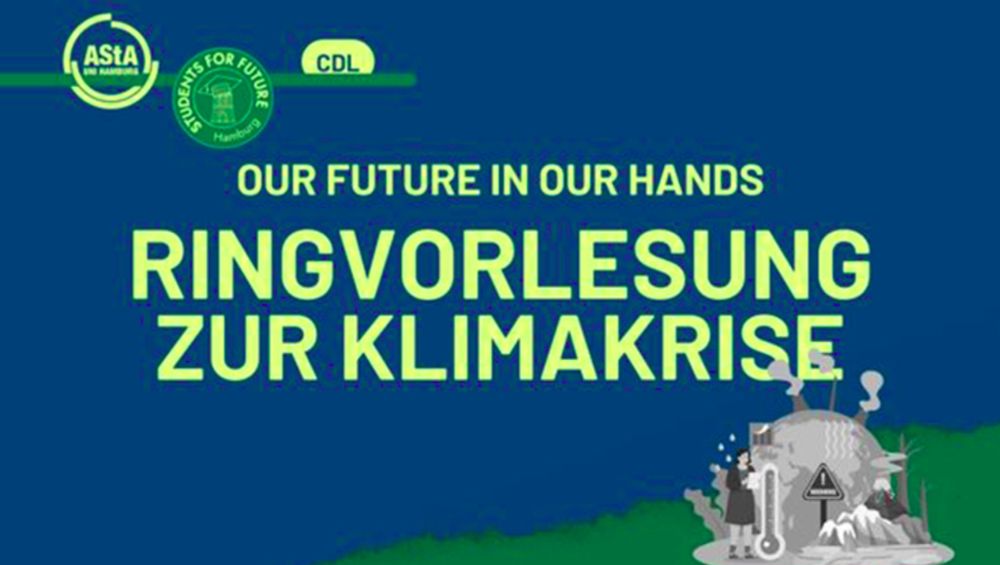
Am kommenden Dienstag gebe ich im Rahmen der Ringvorlesung zur Klimakrise an der @uni-hamburg.de einen Vortrag zu den physikalischen Grundlagen der Klimakrise. Der Vortrag ist öffentlich, also gerne vorbeikommen!
Freue mich auf den Austausch! #climatecomms
www.zfw.uni-hamburg.de/oeffentliche...
Comparing global km-scale climate models to the resolution of coarser CMIP6 models.
The video shows precipitation flux and accumulated precipitation for 2025, ending with a quantification of the difference in resolutions.
Animation: Michael Böttinger (DKRZ)
Method & paper: bsky.app/profile/luka...
See also the amazing visualization made by DKRZ based on our work 👇👇
bsky.app/profile/luka...
Here's also my thread on the main findings: /profile/lukasbrunner.bsky.social/post/3lrsdhwkev22y
Here is the thread to the original publication:
bsky.app/profile/luka...
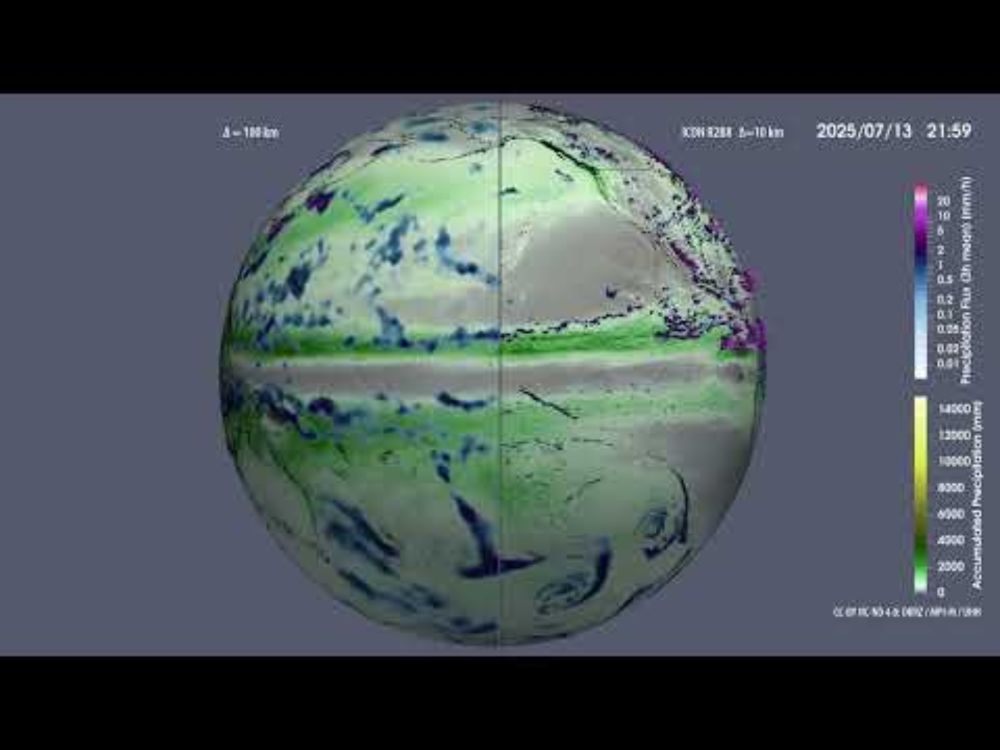
Amazing visualization of our recent sub-grid variability work by Michael Böttinger (DKRZ) 🤩.
It shows the local detail in global precipitation resolved by km-scale models. From 0:50 in direct comparison to CMIP6-type 100km. From 2:07 the sub-grid variability is shown. 🤓🧪
youtu.be/fzA92tSF4ZM?...
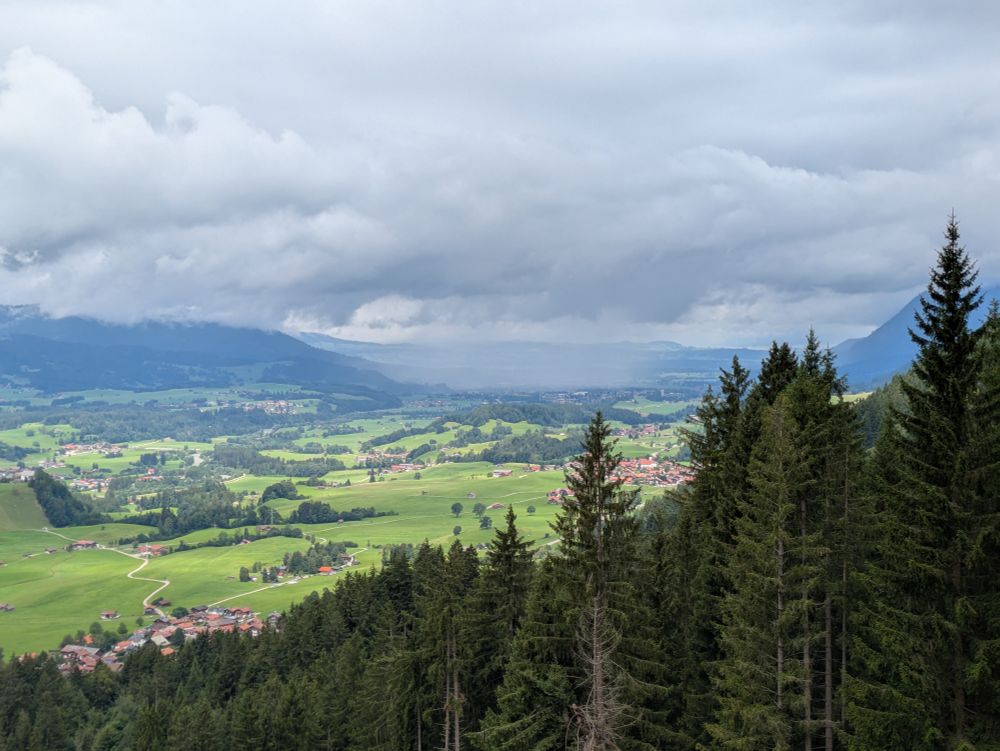
Local downpour near Oberstdorf, Germany ⛰️

Mehr zum Format und zukünftigen Vorlesungen: www.uni-hamburg.de/wissen-fuer-...

Vor einigen Wochen durfte ich im Rahmen des Formats Vorlesung für Alle der @uni-hamburg.de einen Vortrag zu Temperaturextremen geben. Die Aufzeichnung ist jetzt auf YouTube 👇 Danke für die Einladung und das Interesse!
youtu.be/0KGi4Y6J2Ls?...
New paper in ERL! We study the importance of resolution for the representation of climate extremes.
We use a new generation of km-scale models to show that many important details about temperature and precipitation extremes are hidden at CMIP6-like resolutions.
doi.org/10.1088/1748...

Text reading "start a climate conversation" superimposed over the global warming stripes.
Today is #ShowYourStripes Day!
Created by @edhawkins.org, the warming stripes show temperature each year: blue for cool, white for avg, red for hot.
Athletes are wearing them, knitters are knitting them, and cities are putting them on trams.
Find + share your "stripes" here: showyourstripes.info
Annually the impact of climate change is pretty clear even locally. And even on a daily basis the signal starts to emerge!
For regular updates on daily Hamburg temperatures in a long term context, check out my bot @weather-climate.bsky.social (still 🚧)
2025 so far: bsky.app/profile/weat...
Book cover: Welt ohne Morgen by Tom Roth
Scary but fitting read for the occasion 🫣
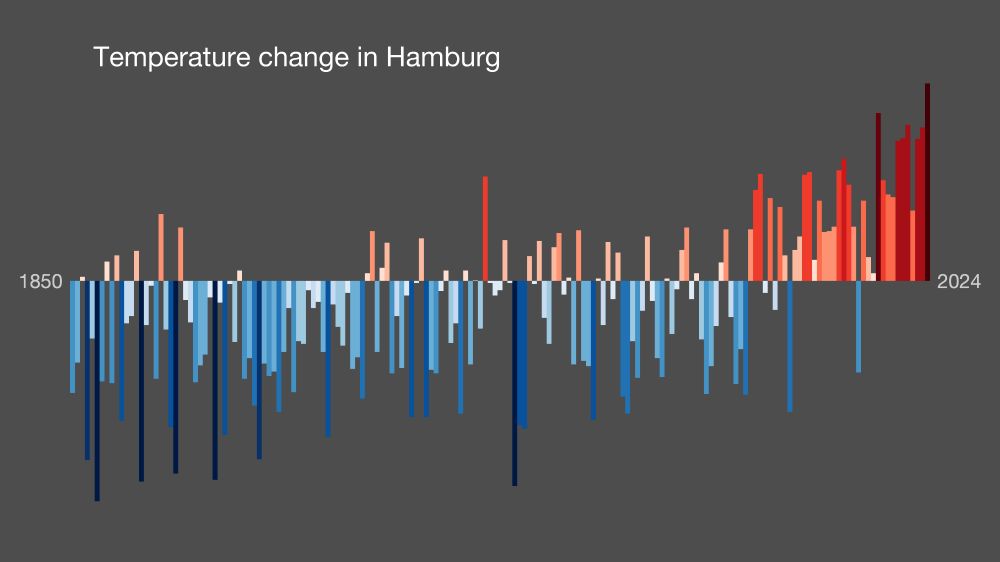
Temperature anomaly relative to 1951-2010 in Hamburg, Germany
#ShowYourStripes day #SystemChangeNotClimateChange

The first 3 eps of TOTALLY COOKED have landed!
Check it out for weather & climate in a factual, relatable & often humorous way.
Available below, & where you get your podcasts.
Like, follow & share.
Let's tackle the climate crisis together.
#totallycooked
www.21centuryweather.org.au/engage/total...
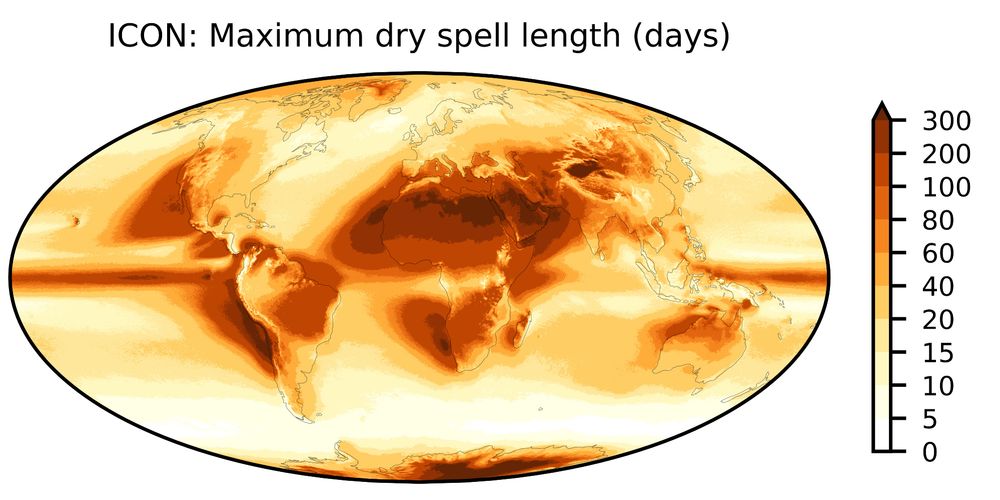
The repository is hierarchical. Click on the rightmost tab, there you can select one of the two models, and then again one of the two resolutions. At the lowest level, there is a green 'Download' button.
Here's a direct link to the high-resolution IOCN results: www.wdc-climate.de/ui/entry?acr...
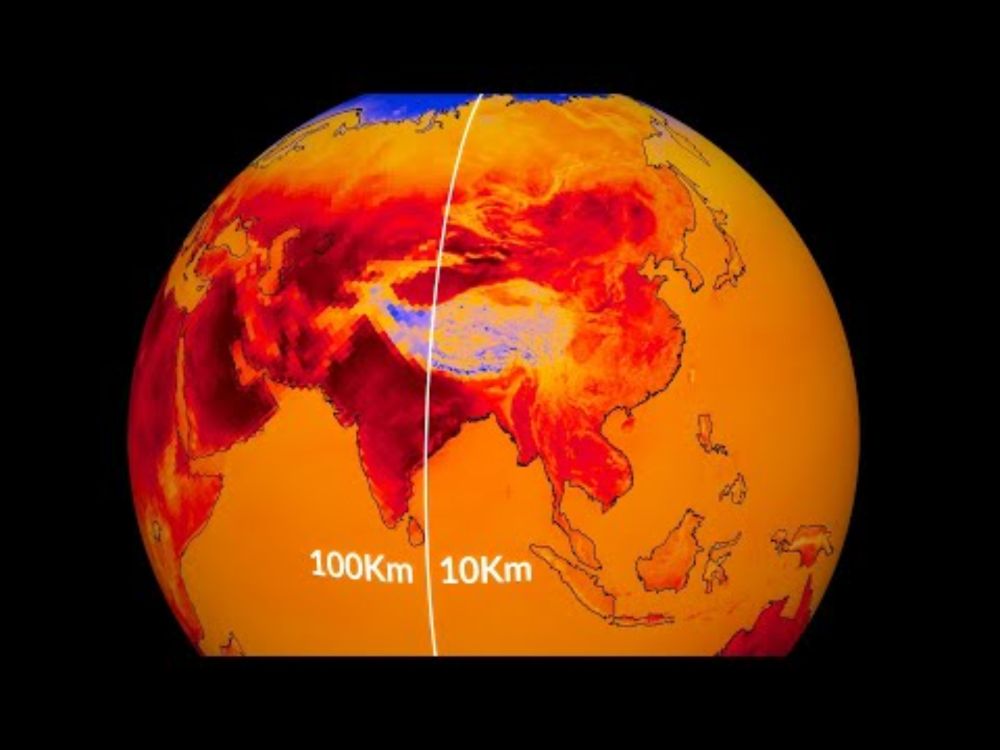
@cenunihh.bsky.social climate visualization lab has created this nice animation of the resolution effect on climate extremes! 🤩 Comparison of CMIP6-like 100km and the new 10km for the example of TXx (hottest day in the year).
Details in the paper: doi.org/10.1088/1748...
youtu.be/R5laSSVHUAk?...

Portrait of climate researcher Lukas Brunner, including his quote: “Resolution is important for climate extremes! Peak temperatures can be up to 10°C higher in next-generation climate models just due to their finer resolution. These findings are particularly important for robust risk assessments.” Photo: L. Brunner
Resolution matters: Extreme temperatures in e.g. Indian cities can be underestimated by up to 10°C, a paper by @lukasbrunner.bsky.social shows. High-res climate models (<10 km) reveal that important details about extremes are hidden at lower resolutions. iopscience.iop.org/article/10.1...
We are working on related topics right now but I can't make any specific promises at this point.
Having said that: we have published all the data that go into our study as netCDF (thats annual extreme indices from 2021-2049)👇
bsky.app/profile/luka...
@erichfischer.bsky.social @omartius.bsky.social @janasillmann.bsky.social @uni-hamburg.de @cenunihh.bsky.social @ioppublishing.bsky.social
An extensive database of plots for all ETCCDI climate extreme indices is also available under a CC BY license on Zenodo: doi.org/10.5281/zeno...

The code we used to produce our figures is freely available under a permissive license. If you want to work with it and have any questions, feel free to reach out to me. There are also open master’s thesis projects on the topic!
github.com/lukasbrunner...
We focus on a subset of the 27 ETCCDI climate extreme indices in the paper. But we have published the full set of ETCCDI indices with 10km resolution globally at the World Data Center for Climate here:
doi.org/10.26050/WDC...

We calculate extreme indices from two ~10km models (ICON & IFS). From them we quantify what information is lost at CMIP6-like resolutions of ~100km.
To do so we introduce the concepts of sub-grid variability and sub-grid anomaly. Details in the paper:
iopscience.iop.org/article/10.1...
New paper in ERL! We study the importance of resolution for the representation of climate extremes.
We use a new generation of km-scale models to show that many important details about temperature and precipitation extremes are hidden at CMIP6-like resolutions.
doi.org/10.1088/1748...

#EGU25 is about to start!
If you're there, check out our session on High-impact Climate Extremes on Tuesday, room 🟨 F1
🧪: meetingorganizer.copernicus.org/EGU25/sessio...
With many exciting talks, including the CL Division Outstanding ECS Award Lecture by
@kornhuber.bsky.social
Great workshop on atmospheric temperature changes by @wcrpclimate.bsky.social in Graz! Thanks for including me in this interesting and insightful exchange!
