
I’ve never done this, that must be why I am single.
28.02.2026 04:14
👍 1
🔁 0
💬 0
📌 0
I’ve never done this, that must be why I am single.
Maybe that will be where the annual hail event will target this year.

You may find this map shocking. The crazy imbalance even surprised me!
It’s the ratio of record highs vs record lows in each city since 2020. That’s right, in Miami there have been 115 daily record highs, but only 1 record morning low! Phoenix: 138 to 0!… 1/

Grazalema, Spain, received over 2,000 mm (78 inches) of rain in just the last 20 days.
Over a year’s worth of rain — and it’s only early February. This is hydrologically absurd.
![A photo of the inside of a cave that has an opening at the top through which a perfect beam of light enters the room, filling it with a golden light and highlighting the dust suspended in the air. Directly below the opening in the ceiling is a pule of rocks from the collapse, with a circle of vibrant green ferns growing atop them. On the far right is a smaller hole that I climbed down through to enter the cave. [note: I will not publicly disclose this location due to the sensitive ecosystem within]](https://cdn.bsky.app/img/feed_thumbnail/plain/did:plc:acm2yz57z6weqbdbw5lpluu3/bafkreifrvpmyeo323nekvzthxshjlljhkuugqfc4jsocls7tpbzoa76z2i@jpeg)
A photo of the inside of a cave that has an opening at the top through which a perfect beam of light enters the room, filling it with a golden light and highlighting the dust suspended in the air. Directly below the opening in the ceiling is a pule of rocks from the collapse, with a circle of vibrant green ferns growing atop them. On the far right is a smaller hole that I climbed down through to enter the cave. [note: I will not publicly disclose this location due to the sensitive ecosystem within]
Every now and then, I come across a place in nature that simply doesn't feel real. Crawling down a small hole in the absolute middle of nowhere and stepping into this scene was like being transported to another world. I found myself enchanted and struggled to leave for quite some time. #Photography

Though still murky thanks to warm water off Japan the PDO is looking more positive than most times this decade. You can see the +PMM connect with warmth in the WPAC as well. This has been slowly headed east. El Nino is on the way and it should have more PDO support than 2023
Wish I could have been there!

This line graph illustrates the percentage change in agency staff levels from the previous year for nine major U.S. federal scientific and health organizations between the fiscal years 2016 and 2025. The agencies tracked include the CDC, Department of Energy, EPA, FDA, NASA, NIH, NIST, NOAA, and NSF. For the majority of the timeline between 2016 and 2023, the agencies show relatively stable fluctuations, generally staying within a range of +5% to -5% change per year. However, there is a dramatic and uniform plummet starting in the 2024–25 period. Every agency depicted shows a sharp downward trajectory, with staffing losses ranging from approximately -15% to over -25%. The Environmental Protection Agency (EPA) shows the most significant decline, dropping to roughly -26%, while the National Institute of Standards and Technology (NIST) shows the least severe but still substantial drop at approximately -15%.
This is the most astonishing graph of what the Trump regime has done to US science. They have destroyed the federal science workforce across the board. The negative impacts on Americans will be felt for generations, and the US might never be the same again.
www.nature.com/immersive/d4...
How un-kind of it.
I was just thinking the same thing.

60-day precipitation departure from normal. Most all states, with a few notable exceptions, are quite dry.
Does that mean you attended post Post Malone?

It's been a dry last 30 days for most places.

The 50th Anniversary of the Wreck of the Edmund Fitzgerald: A New Perspective on an Old Storm: cimss.ssec.wisc.edu/satellite-bl...

FEMA has denied or not advanced most Kerr County aid applications after deadly July 4 flood.
grist.org/extreme-weat...
#Texas #TX #Flood #FEMA #Weather
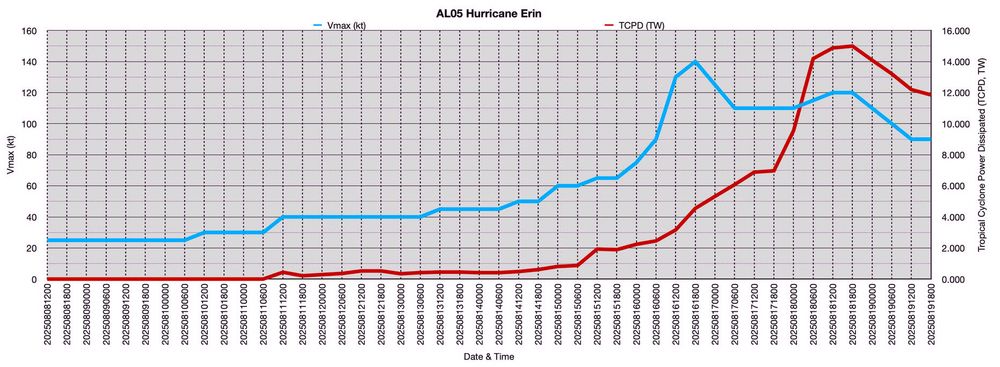
A line graph displaying the one minute maximum sustained winds of Hurricane Erin compared to the power dissipated over the entire circulation. The two curves show some correlation between each other, but diverged during the period when Hurricane Erin grew in size between its first and second intensity peaks.
Pretty neat! I made a graph comparing Erin's Vmax with the power it is dissipating over its entire circulation. Cool to see it go up as Erin was expanding (as your radii show very well), despite the intensity coming down off the main peak.
I liked it better when 1488 was just an FM road north of Houston. Sad!
Hey, this is what I’m paid to do!
Tough but fair.
It might be hard right now, but thank you for your hard work and dedication to your profession. This sounds like one of the most difficult uses of your skill, but thank you.
That was also true in 1996, but for the wrong reason, it was 100.
Gotta wait until after August 7th here.

A photo of Yosemite NP from Washburn Point, featuring Half Dome, Vernal Falls, and Nevada Falls.
Art. #photography
Better forecasting of flash floods is needed. NOAA’s National Severe Storms Laboratory “is working to develop higher resolution modeling, but it's on the chopping block in the president's proposed budget.”
This is a dangerous lie.
30 of 122 WFOs don’t have an MIC.
NWS is famously flexible, but you can’t let 14% (600/4300) of an already thin workforce go - especially the senior staff - and then claim “overstaffing”.
You can only stretch a rubber band so far before it snaps.
Flood Watch issued yesterday at 1:18 pm.
WPC had mesoscale discussions throughout the event.
NWS issues Flash Flood Warning at 1:14 am.
NWS issues Flash Flood Emergency at 4:03 am.
NWS was on the ball.
The challenge is always getting the warning the last mile and getting people to respond.
The missing piece of this viral post is that the Texas officials are lying and deflecting blame. The NWS, hobbled as it is, issued an accurate flood watch for Kerr County the evening before and accurate escalating warnings overnight as the flood was developing.
Lots of thunder with this one. I'm just a few miles southeast of it at the moment. With how it's behaving on radar and satellite, this could be a real bad one.

Over 7 inches in the last two hours west of Round Rock...
*This* is why we call the Balcones Escarpment area, the Texas Hill Country, Flash Flood Alley.
Locals and longtime visitors know, it can be very dangerous very fast. I can only really compare it to mountain flash flooding- just rain sluicing off of rock and into the closest channels.