🤩
21.01.2026 16:39
👍 0
🔁 0
💬 0
📌 0
En route to Yellowknife NWT just in time for some real winter weather 🥶
06.12.2025 18:15
👍 6
🔁 0
💬 0
📌 0

We are kicking off the mappiest week of the year - our first Map Bracket Showdown! Starting today, we’ll post head to head competitions of some of @gfiske.bsky.social gorgeous storytelling, and innovative data visualizations.
Vote for your favorites and learn about the science behind the art.
14.10.2025 14:59
👍 7
🔁 3
💬 2
📌 0

Day 1️⃣ of Climate Week
Stay tuned for updates from our panel discussions and partner collaborations.
Map by @gfiske.bsky.social
@permafrostpathways.bsky.social
22.09.2025 16:06
👍 5
🔁 3
💬 0
📌 0

Join our list between September 8 and October 17, and you’ll be entered into our email raffle for a chance to win a beautiful printed map by Woodwell Climate’s own @gfiske.bsky.social
08.09.2025 18:32
👍 3
🔁 3
💬 1
📌 0

Returned to my desk this week to find that the kind folks at Google Earth Outreach have uploaded the entire latest version of the ArcticDEM mosaic (v4.1) to the GEE archive.
developers.google.com/earth-engine...
Presently cleaning ~17tb from my hard drive :)
04.09.2025 17:11
👍 24
🔁 4
💬 1
📌 0

This map from @cmshintani.bsky.social shows the range of the nomadic Dukha reindeer herders on the high taiga of northwest Mongolia.
28.08.2025 16:07
👍 9
🔁 3
💬 1
📌 0

Woodwell Climate Conversations: Mapping the Arctic, Charting the Future
Harnessing finance and science to scale nature-based climate solutions.
If you happen to be visiting Cape Cod next week, stop by, have a drink, and join Sue Natali and I for a discussion about maps 😎
bit.ly/4fKIBXJ
20.08.2025 11:41
👍 18
🔁 7
💬 0
📌 0
And we’re already hard at work discussing map information.
09.08.2025 02:01
👍 12
🔁 2
💬 1
📌 0

Starlink


After many days of travel: inc four flights, 8 hours of 4x4 off roading, and a half day (and into the night) on horseback, we’ve reached the Dukha reindeer camp on the east taiga of Mongolia, just 10 miles from the Russian border. And they have starlink! 🙂
08.08.2025 02:50
👍 58
🔁 7
💬 4
📌 1
Yes, we have (temporary) Arctic map tattoos… 😎
#climate #arctic #warming #maps
📸 by Jess Howard
17.07.2025 15:52
👍 8
🔁 0
💬 0
📌 0
🗺 This week, our team is raising awareness about Arctic change at #EsriUC2025 in San Diego. Today, @cmshintani.bsky.social's “Navigating the new Arctic"—co-produced with Sámi partners at the International Centre for Reindeer Husbandry —is featured in the Map Gallery.
15.07.2025 02:31
👍 40
🔁 10
💬 2
📌 2
Very much appreciate the shout out by Jack here for Woodwell maps. This particular map is a @cmshintani.bsky.social original that elegantly highlights a small portion of our nearly two decade research in the Congo.
14.07.2025 18:37
👍 11
🔁 1
💬 1
📌 0

Meet our new Cartography Intern, Nicole Pepper! (@maps-and-pepper.bsky.social). Stay tuned for more data visualization projects from her, including this map showing a late June heat dome that brought record temperatures to the Northeast.
03.07.2025 17:45
👍 19
🔁 2
💬 3
📌 2
A beautiful map with a touch of infographic goodness!
03.07.2025 18:45
👍 8
🔁 0
💬 0
📌 0
Unpacking the Recent Heat Wave with an animation of NOAA's Real-Time Mesoscale Analysis (RTMA) data 🗺️
Stay cool this summer folks!
27.06.2025 16:11
👍 20
🔁 7
💬 1
📌 0
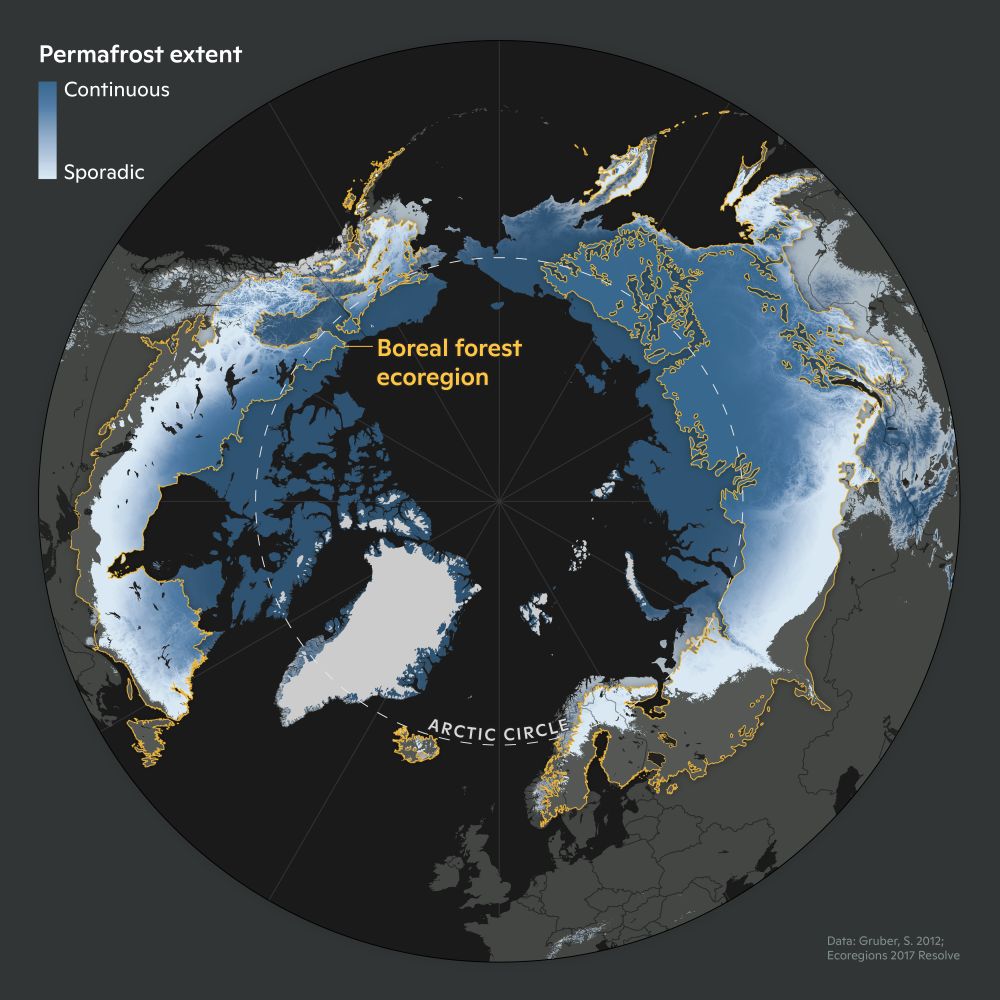
Black, blue, gray and yellow stereographic map depicts permafrost extent and the boreal forest ecoregion in the circumpolar north. Text: Data: Gruber, S, 2012. Ecoregions 2017 Resolve
Our boreal fire team @woodwellclimate.bsky.social is in D.C. this week to discuss responses+solutions to address the severe northern #wildfires impacting people, animals, and ecosystems.
We'll be adding to this resource 🧵, so please let us know what you'd like to see.
(🗺️ by @cmshintani.bsky.social)
09.06.2025 20:05
👍 13
🔁 7
💬 1
📌 1
Taking a quick peek at firesmoke.ca/data/ ... things are heating up.
04.06.2025 13:48
👍 31
🔁 15
💬 2
📌 1

From extreme storms, to record drought, wildfires, severe flooding, and warming temperatures, the reality is today’s climate is already creating unlivable conditions for communities.
These maps by @cmshintani.bsky.social show climate change and its damaging symptoms.
28.05.2025 14:33
👍 7
🔁 3
💬 1
📌 1

'tis the season... Happy Mountainfilm everyone! 🎥✨
📸: Palma Caruso
23.05.2025 16:46
👍 2
🔁 1
💬 0
📌 0

Climate Adaptation Specialist Brooke Woods invited to speak at Mountainfilm 2025 - Permafrost Pathways
⛰️ We're thrilled that Brooke Woods, Alaska Native fishing rights advocate and Climate Adaptation Specialist at @woodwellclimate.bsky.social, is speaking at #Mountainfilm Festival tomorrow!
🐟 Learn more about Woods, her work advocating for Alaska Native-led salmon fisheries, and the esteemed panel:
22.05.2025 15:30
👍 9
🔁 5
💬 1
📌 0

We are sending huge congratulations to @gfiske.bsky.social whose maps highlighting Arctic change will be displayed in an iconic mural location in Telluride, CO for an entire year. Here's a peek at the mural unveiled at Mountainfilm this week.
(📸 : Stash Wislocki)
21.05.2025 19:23
👍 27
🔁 6
💬 1
📌 0


