Vasco Asturiano's Avatar

Vasco Asturiano

@vasturiano

Empowering humans, one pixel at a time. #ux #dataviz https://github.com/vasturiano https://observablehq.com/@vasturiano

33
Followers
67
Following
91
Posts
10.03.2025
Joined
Posts Following

Latest posts by Vasco Asturiano @vasturiano

Plasma Simulation of attraction-of-opposites particles, similar to the interaction between protons and electrons. Uses D3's force plugin forceMagnetic to simulate the asymmetrical attraction/repulsion of obj...

Simulation of attraction-of-opposites particles. 🧲 #usetheforce

16.03.2025 22:32 πŸ‘ 3 πŸ” 0 πŸ’¬ 1 πŸ“Œ 0
Binary Star System A simulation of orbital trajectories using the d3-force simulation engine with the gravity-like d3-force-magnetic attraction force. By default the layout represents a binary system. All the stars (red...

Force simulation of orbit paths around a binary star system. β˜€οΈπŸŒ‘πŸŒŒ observablehq.com/@vasturiano/... #usetheforce #d3js #spaceistheplace

13.03.2025 14:16 πŸ‘ 2 πŸ” 0 πŸ’¬ 0 πŸ“Œ 0
Preview
Quad Pong A quadrilateral self-version of the Pong classic game. Uses the d3-force simulation engine and custom forces to handle the collision and bounce between balls (d3.forceBounce) and with the paddles (d3.forceSurface). Click-drag to control the paddles' horizontal and vertical positions. Each time a ball bounces on a paddle you get 1 point. Each time it goes off screen you lose 2 points. Use the top-left +/- buttons to add/remove balls from the system. DOM manipulation State Force Simulation Settings Components

Game of Pong? https://observablehq.com/@vasturiano/quad-pong
#usetheforce #pong #d3js

12.02.2023 14:58 πŸ‘ 1 πŸ” 0 πŸ’¬ 0 πŸ“Œ 0
Preview
The Internet is Getting Safer: Fall 2020 RPKI Update The cap of two hundred thousand routing cryptographic records was recently passed. We thought it was time for an update on a major year for RPKI.

Update on the state of RPKI. Great read from @lpoinsig including some of my data visualizations! 😎 https://blog.cloudflare.com/rpki-2020-fall-update

07.11.2020 02:32 πŸ‘ 3 πŸ” 0 πŸ’¬ 0 πŸ“Œ 0
Video thumbnail

Check out the latest stats on #COVID19 cases per country. πŸ“Š https://observablehq.com/@vasturiano/covid-19-bar-chart-race

11.06.2020 01:29 πŸ‘ 1 πŸ” 0 πŸ’¬ 0 πŸ“Œ 0
Preview
Moon Landing Sites Mapping the sites of various moon landing locations. Colored by Space Agency. Plotted using globe.gl. Style Settings Data Dependencies

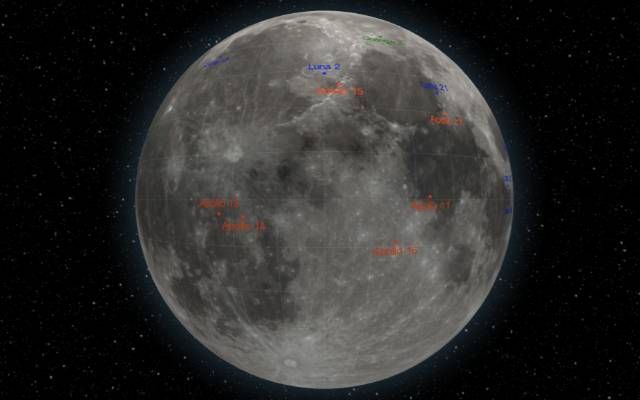
If anyone wants to get their mind off things, here are the locations we've landed on another celestial body. #keeplookingup https://observablehq.com/@vasturiano/moon-landing-sites

02.06.2020 05:59 πŸ‘ 0 πŸ” 0 πŸ’¬ 0 πŸ“Œ 0
Post image

Current recovery state of countries with #COVID19. Check out the animated version at https://observablehq.com/@vasturiano/covid-19-bar-chart-race 😷 #StayHome

24.04.2020 03:54 πŸ‘ 0 πŸ” 0 πŸ’¬ 0 πŸ“Œ 0
Preview
COVID-19 Bar Chart Race Cases per Million People Data sourced from the John Hopkins University - Coronavirus Resource center, fetched via the Novel COVID API. Major credit to Mike Bostock for his wonderful Bar Chart Race tutorial and code. Settings Data Sourced from https://github.com/NovelCOVID/API Bar Chart Code Dependencies

Animated evolution of #COVID19 cases, normalized by country population, since January till the present. #barchartrace πŸ“Š
https://observablehq.com/@vasturiano/covid-19-bar-chart-race

20.04.2020 01:47 πŸ‘ 0 πŸ” 0 πŸ’¬ 0 πŸ“Œ 0
Remote work, regional lockdowns and migration of Internet usage As a large portion of Internet access shifted from office-focused areas, like city centers and business parks, towards more residential areas like suburbs and outlying towns, we wanted to find out just precisely how broad this geographical traffic migration was.

Visual analysis on the effect of #ShelterInPlace and regional #lockdowns on Internet usage patterns, as seen from @Cloudflare. Have a read! #COVID__19 #StayAtHome
https://blog.cloudflare.com/remote-work-regional-lockdowns-and-migration-of-internet-usage/

11.04.2020 21:17 πŸ‘ 0 πŸ” 0 πŸ’¬ 0 πŸ“Œ 0
Digital Health and Wellness | TechRepublic

Some #DataVisualization I had the pleasure of working on recently, showing Internet usage changes in inner cities, due to #COVID19. https://tek.io/2QPbtDL.

27.03.2020 23:47 πŸ‘ 0 πŸ” 0 πŸ’¬ 0 πŸ“Œ 0
Preview
Coronavirus (COVID-19) Globe Latest data regarding Corona Virus cases, provided by the World Health Organization. Available in API form via https://github.com/NovelCOVID/API. Plotted using globe.gl. Style Settings Data Logs Dependencies

Globe visualization of #coronavirus cases, using latest data from the #WorldHealthOrganization. 🌎https://observablehq.com/@vasturiano/corona-virus-covid-19-globe

12.03.2020 17:35 πŸ‘ 0 πŸ” 0 πŸ’¬ 0 πŸ“Œ 0
Globe.GL UI component for Globe Data Visualization using ThreeJS/WebGL

Great fun last night at the @D3BayArea meetup! Had the opportunity to show http://globe.gl. 🌐🌎😎 #d3js https://x.com/micahstubbs/status/1176701907651452931

25.09.2019 22:29 πŸ‘ 0 πŸ” 0 πŸ’¬ 0 πŸ“Œ 0
Video thumbnail

First day of #d3unconf Chicago!! 😎

26.08.2019 19:09 πŸ‘ 0 πŸ” 0 πŸ’¬ 0 πŸ“Œ 0
Post image

There certainly has been some seismic activity in central Cal recently... https://vasturiano.github.io/globe.gl/example/earthquakes/

08.07.2019 06:20 πŸ‘ 0 πŸ” 0 πŸ’¬ 0 πŸ“Œ 0

Lesson #1 in Data Visualization: LYFA (Label Your F**in Axes). πŸ“Š #datavis #lyfa

19.06.2019 01:21 πŸ‘ 0 πŸ” 0 πŸ’¬ 0 πŸ“Œ 0
Project Galileo: Lessons from 5 years of protecting the most vulnerable online Today is the 5th anniversary of Cloudflare's Project Galileo. Through the Project, Cloudflare protectsβ€”at no costβ€”nearly 600 organizations around the world engaged in some of the most politically and artistically important work online.

Project Galileo: Lessons from 5 years of protecting the most vulnerable online https://blog.cloudflare.com/project-galileo-fifth-anniversary/ via @cloudflare

12.06.2019 21:38 πŸ‘ 0 πŸ” 0 πŸ’¬ 0 πŸ“Œ 0
Preview
GitHub - vasturiano/3d-force-graph: 3D force-directed graph component using ThreeJS/WebGL 3D force-directed graph component using ThreeJS/WebGL - vasturiano/3d-force-graph

Look at that! #hologram of https://github.com/vasturiano/3d-force-graph inside a Looking Glass! Awesome work @neverlastn. πŸ‘πŸ˜Ž #usetheforce https://x.com/neverlastn/status/1137999431247323136

10.06.2019 09:36 πŸ‘ 0 πŸ” 0 πŸ’¬ 0 πŸ“Œ 0
Globe.GL UI component for Globe Data Visualization using ThreeJS/WebGL

http://Globe.gl is here! 🌍 A JS framework for Globe data visualization. Check it out! 😎 https://github.com/vasturiano/globe.gl

07.06.2019 15:40 πŸ‘ 0 πŸ” 0 πŸ’¬ 0 πŸ“Œ 0
The Climate and Cloudflare Power is the precursor to all modern technology. James Watt’s steam engine energized the factory, Edison and Tesla’s inventions powered street lamps, and now both fossil fuels and renewable resources power the trillions of transistors in computers and phones.

The Climate and Cloudflare https://blog.cloudflare.com/the-climate-and-cloudflare/ via @cloudflare

25.04.2019 00:29 πŸ‘ 0 πŸ” 0 πŸ’¬ 0 πŸ“Œ 0
Post image

Playing with BGP updates #visualization using #RIS-live at #NANOG75. It's a fantastic RIS feature! πŸ‘πŸ˜Ž https://github.com/vasturiano/ris-live-viz

20.02.2019 21:59 πŸ‘ 0 πŸ” 0 πŸ’¬ 0 πŸ“Œ 0
Preview
GitHub - vasturiano/d3-radial-axis: A radial implementation of the D3 axis component A radial implementation of the D3 axis component. Contribute to vasturiano/d3-radial-axis development by creating an account on GitHub.

Ever need a Spiral Axis to visualize your data? Grab yours today with d3-radial-axis: https://github.com/vasturiano/d3-radial-axis. 🐚😎#d3 #archimedean #spiral #axis https://beta.observablehq.com/@vasturiano/spiral-axis

05.02.2019 05:24 πŸ‘ 0 πŸ” 0 πŸ’¬ 0 πŸ“Œ 0

Brilliant!! Can you see it?😡 https://x.com/_Kcnarf/status/1085214117751869445

17.01.2019 06:24 πŸ‘ 0 πŸ” 0 πŸ’¬ 0 πŸ“Œ 0
Preview
Currency Horizon Chart A stacked-series Horizon chart showing the USD exchange rate of currencies over time. Blue represents a rate that is higher than the latest, and red a lower one. Using a higher number of horizon division bands (12 in this example) reveals a heatmap-like view, specially with the small vertical space available to each series. Built using the reusable component hilbert-timeseries-chart. Data sourced from https://www.bis.org/statistics/xrusd.htm. Data Dependencies

Horizon charts are not very commonly seen, but they can be very useful to represent dense information in tight vertical spaces, specially with time-series. Here's the evolution of currency prices since 1970: https://beta.observablehq.com/@vasturiano/currency-horizon-chart

21.12.2018 17:46 πŸ‘ 0 πŸ” 0 πŸ’¬ 0 πŸ“Œ 0
Preview
Xmas tesselation Xmas tesselation. GitHub Gist: instantly share code, notes, and snippets.

When you're weird and use #d3js to print your Xmas decoration. πŸŽ„πŸŽ„πŸŽ„https://bl.ocks.org/vasturiano/0c0756681a4a4b3e802942a90fbf442c

09.12.2018 00:10 πŸ‘ 0 πŸ” 0 πŸ’¬ 0 πŸ“Œ 0
Post image Post image

Current view of #RPKI ~18k certs (blue) and ~11k ROAs (red) on a #Hilbert curve, for whole IPv4 space and 2001::/16 IPv6. Credit to @lpoinsig for scraping the data.

16.11.2018 19:29 πŸ‘ 0 πŸ” 0 πŸ’¬ 0 πŸ“Œ 0
Cloudflare Peering Portal - Beta Cloudflare launches Peering Portal - Beta to allow network operators and hosting providers to explore transit savings, performance benefits and traffic Management opportunities for peering with Cloudflare or hosting a node

Cloudflare launches Peering Portal! https://blog.cloudflare.com/cloudflare-peering-portal-beta/ via @cloudflare

22.10.2018 23:34 πŸ‘ 0 πŸ” 0 πŸ’¬ 0 πŸ“Œ 0

Very cool integration of 3d-force-graph with #neo4j. 😍 Thanks @mesirii for the awesome write-up and all the cool examples! #usetheforce https://x.com/mesirii/status/1021512503271059457

24.07.2018 00:37 πŸ‘ 0 πŸ” 0 πŸ’¬ 0 πŸ“Œ 0
Preview
Geostationary Satellites Geostationary Satellites. GitHub Gist: instantly share code, notes, and snippets.

Watch the daily swing of Earth's #geosynchronous #satellites as they hover around the equatorial plane. #d3js #roundandround https://bl.ocks.org/vasturiano/9bdeddb97d5c71f425743442761d5384

24.05.2018 16:21 πŸ‘ 0 πŸ” 0 πŸ’¬ 0 πŸ“Œ 0
Preview
Satellites Voronoi Satellites Voronoi. GitHub Gist: instantly share code, notes, and snippets.

Animated Voronoi diagram of #earth's artificial #satellites projected at their zenith coordinates. https://bl.ocks.org/vasturiano/59adce85e23f92a1e76bb09612a3a215

21.05.2018 17:17 πŸ‘ 0 πŸ” 0 πŸ’¬ 0 πŸ“Œ 0
Preview
Earth Satellites Earth Satellites. GitHub Gist: instantly share code, notes, and snippets.

Ever wondered how much metal we put up in the skies? Here's a view of the motion of artificial #satellites orbiting around #earth. #roundandround https://bl.ocks.org/vasturiano/818f5fa0f91f9f3d8a29efe9bf66f8b3

21.05.2018 17:06 πŸ‘ 0 πŸ” 0 πŸ’¬ 0 πŸ“Œ 0