

includes cool viz from @jonathanvincent.bsky.social on past FX interventions by Japanese authorities
www.ft.com/content/76fd...
26.01.2026 15:31
👍 8
🔁 3
💬 1
📌 1
includes cool viz from @jonathanvincent.bsky.social on past FX interventions by Japanese authorities
www.ft.com/content/76fd...

"Those 18-year-olds – the first guinea pigs, the class who matriculated in 2012 – are now turning 31. And belatedly, the impact of the loans they were assured were a rock-solid investment in their futures is becoming apparent."
Some thoughts on student loans
www.newstatesman.com/politics/uk-...

How the AI boom compares to past technological bubbles, including the British Railway Mania of 1845
as.ft.com/r/0a844158-d...

A chart of the projected percentage point increase un share of income paid as income tax and national insurance from 2025/25 through to 2029/30. It whos that 'fiscal drag' is set to hit those at or near frozen personal tax thresholds

Screenshot of financial times fiscal drag calculator.
New: 'Shark's fin' chart reveals the uneven impact of 'fiscal drag', the stealth tax beloved of recent chancellors. Plus use our interactive calculator to see how fresh freezes announced by Rachel Reeves at todays Budget could affect you on.ft.com/3KqOYUL

This is absolutely fascinating: you can put your postcode in and see relative levels of deprivation (and the opposite) where you live in detail. I live where I grew up, so I could spend days doing this as I know the town so well. www.ft.com/content/9a1c... Huge congrats to @amyborrett.ft.com et al.

For this story, we used AI to read more than 13,000 documents to identify which MEPs declared a conflict of interest. While dozens have side jobs overlapping with their parliamentary duties, only eight declared a conflict of interest.
With @jonathanvincent.bsky.social
www.ft.com/content/0466...

Mirror, mirror, on the wall, what's the most unfair tax of them all?
An #FTEdit 🧵on the madness of council tax 👇

A grid of small charts compares trends in house prices and council tax bills across UK local authorities since 1995. Each chart shows two indexed lines: one for average house prices (blue) and one for average council tax bills (grey), both normalised to 1 in 1995. The top section displays towns and cities in northern England — such as Barnsley, Bradford, Burnley, County Durham, Northumberland, North Yorkshire, Preston, Redcar and Cleveland, and Sunderland — where the two lines rise together over time, indicating that house prices and council tax bills have increased broadly in line. The lower section forms a cartogram map of London boroughs, where house prices have risen much faster than council tax bills. In boroughs such as Kensington and Chelsea, Westminster, Camden, Hackney, Islington, and Waltham Forest, the blue line representing house prices climbs steeply compared to the flatter grey council tax line. The layout mirrors the approximate geography of London, with boroughs like Enfield and Barnet at the top and Croydon, Bromley, and Sutton at the bottom. Source: Financial Times analysis of data from the Office for National Statistics (ONS) and the Valuation Office Agency (VOA). London cartogram design based on a concept by Max Gadney and Mike Gallagher.
Great piece of data journalism on the widespread anomalies in council tax banding, by @jonathanvincent.bsky.social and Sam Fleming and involving our great engineering teams on both the front- and back-end of the project. #ddj Plus a nod to some classic #dataviz design by @theboysmithy.ft.com:

Screenshot of an interactive Sankey diagram showing how sale prices since January 2024 of properties in Waltham Forest relate to Council Tax bands. Band C sales are highlighted, which show sale prices ranging from under £200,000 to £1mn+
Council tax valuation bands in England are increasingly disconnected from house prices - new with Sam Fleming and Jonathan Vincent. You can even tap in your own details to see how unfair your council tax bill is on.ft.com/46JBbB9

In charts: drought risk as England faces driest year this century 📊
https://www.ft.com/content/8e69c305-8f22-4052-817d-5397f107d8c8
UK delay data doesn't include cancelled trains, so I excluded them from the German data in our analysis.
The exact metrics for cancellations differ, but the ORR reports around 4% of trains fully and 2% part cancelled in GB. While Germany had 6.7% of stops cancelled in 2024. So it's broadly similar
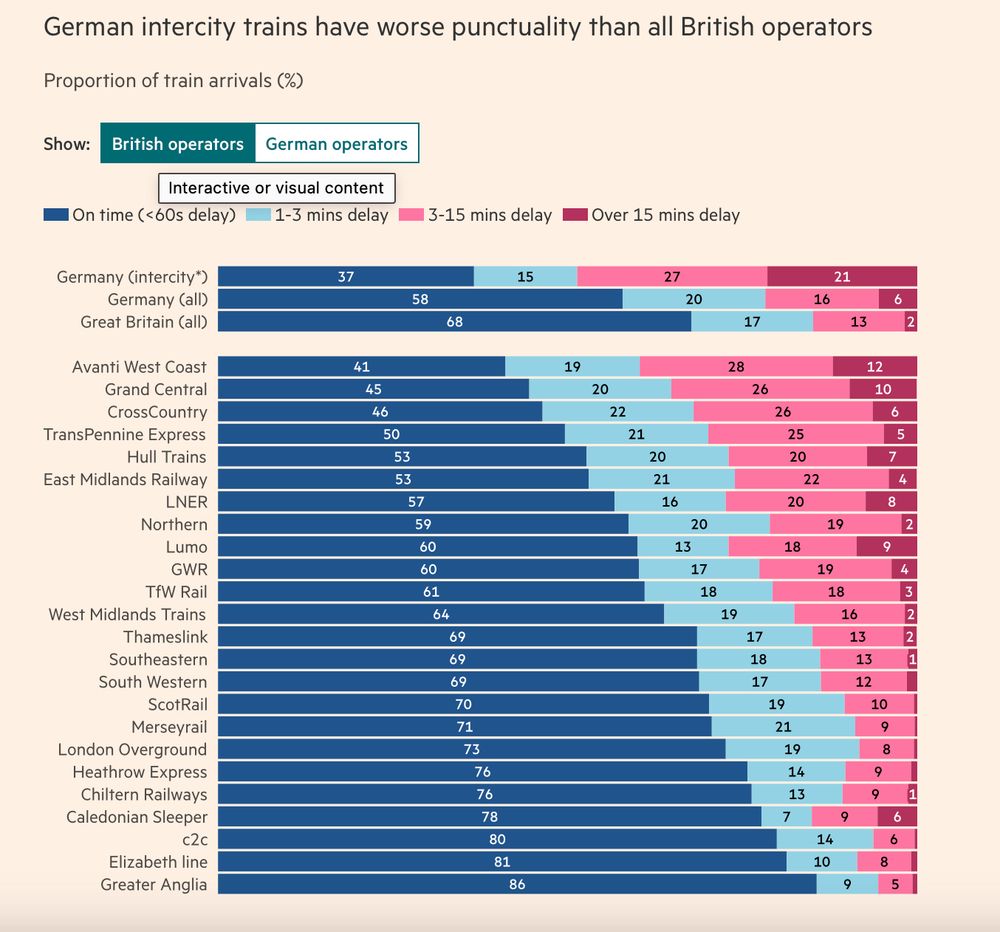
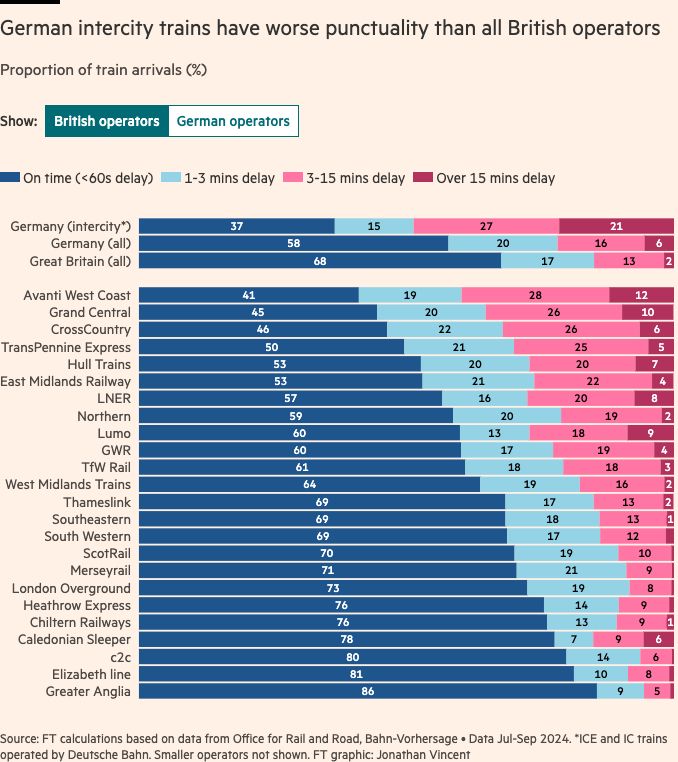
Olaf Scholz mocked British railways over “broken tracks and bad trains”, claiming that "nothing works any more” in the UK. Turns out: Germany rail problems have become so bad that Deutsche Bahn long-distance service is less punctual than even the worst operator in Britain. www.ft.com/content/d3b6...
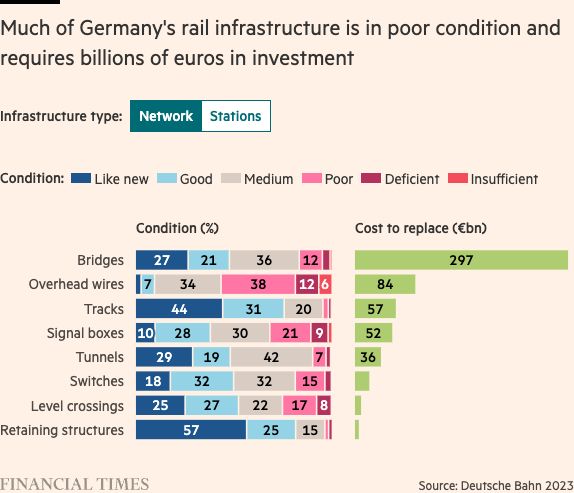
The root issue, according to Deutsche Bahn themselves, is the poor condition of their rail infrastructure, which will cost billions to replace at a time when future funding remains uncertain
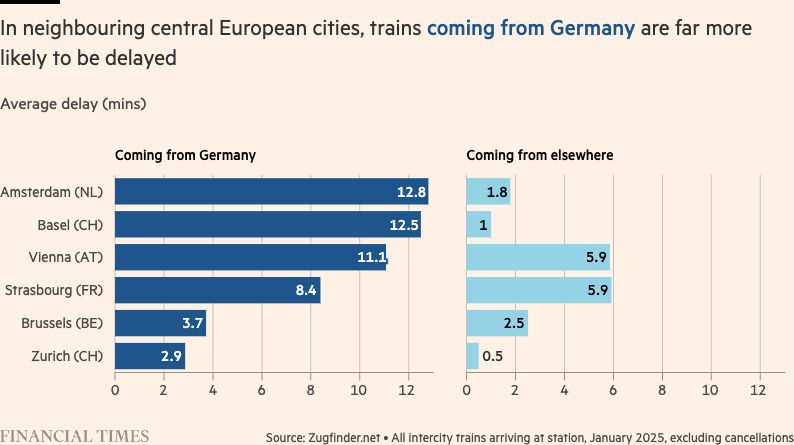
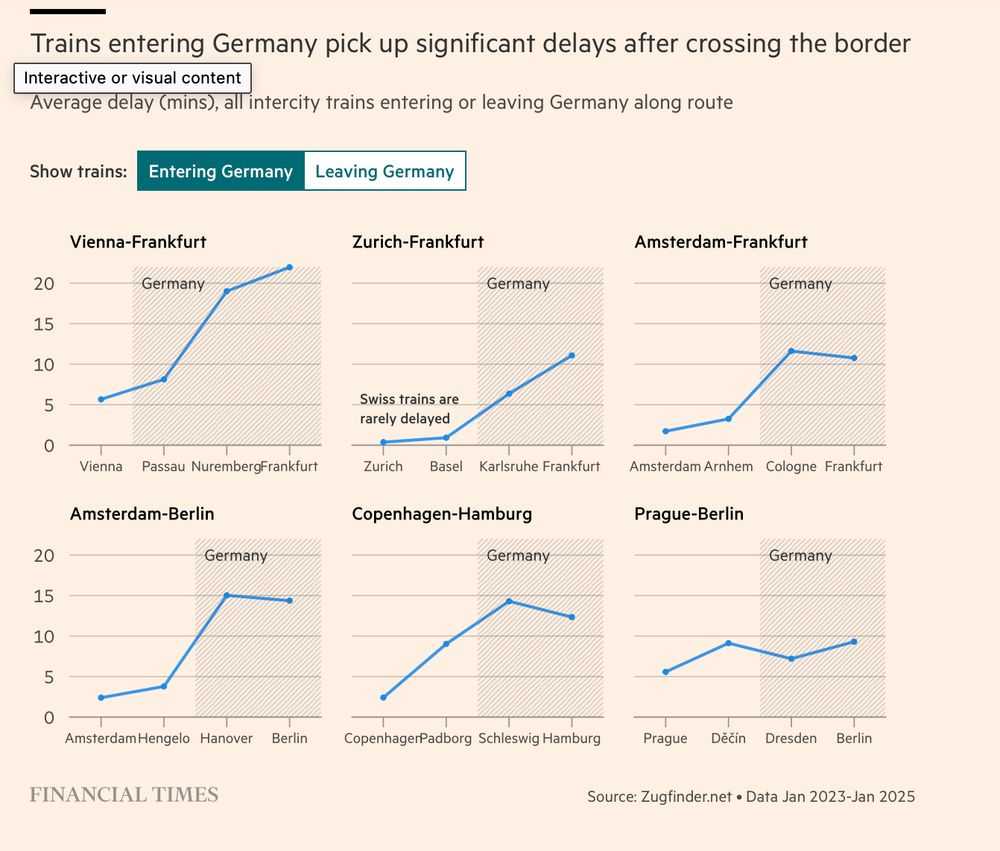
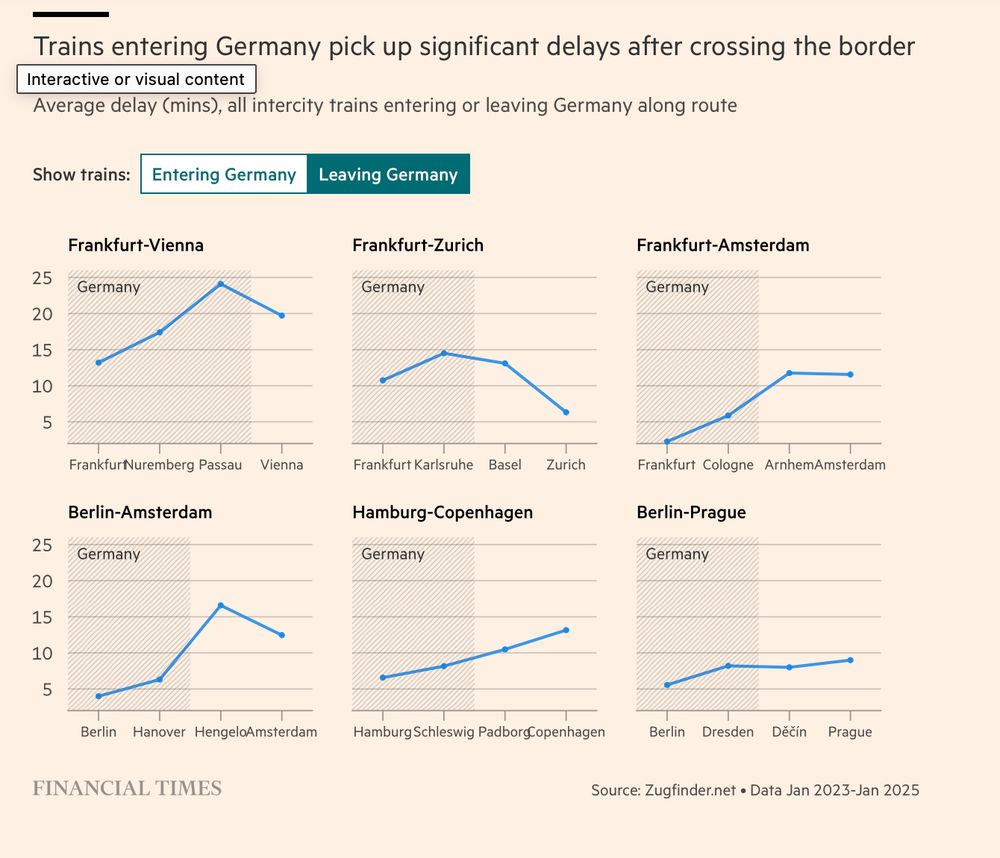
This causes issues across central Europe, with German delays spilling out into the Netherlands, Belgium, France, Switzerland and Austria
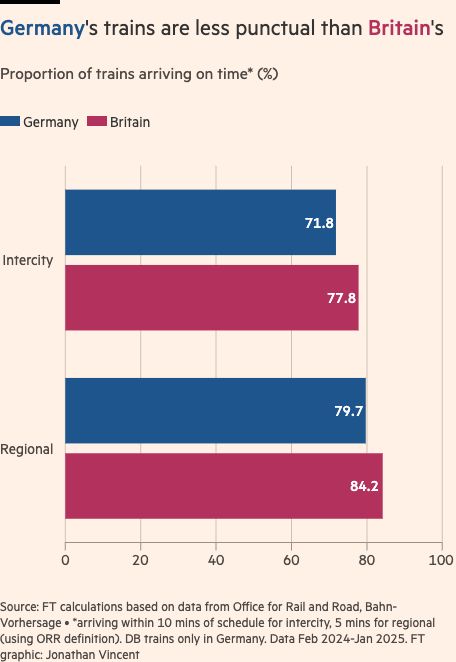
Britain and Germany generally use different metrics to measure punctuality, but using data provided by bahnvorhersage.de, I was able to compare the two networks directly.
DB's intercity trains are now more delayed than even Avanti, Britain's worst performing operator
My article comparing British and German rail punctuality in the
@financialtimes.com today with @olafstorbeck.ft.com
While British trains perform poorly, the German network suffers even more from delays, especially on intercity lines.
on.ft.com/4gKX4Sf
In a debate last week, Olaf Scholz argued that rail privatisation in Germany would “end as badly as in England, where nothing works any more”.
But how does Deutsche Bahn really compare to UK trains? @jonathanvincent.bsky.social crunched a few billion datapoints to check: on.ft.com/4hFuxyX