
January 2026 saw a strong contrast in extreme temperatures across the globe.
🌨️ North America:
Nearly all of Canada, and most of the USA, experienced 'very strong cold stress' (feels-like -27°C or lower).
⬇️
06.02.2026 09:03
👍 33
🔁 13
💬 1
📌 2
Maps and charts shape how we see the climate crisis. Visualising Climate asks how we can design visuals that inform without oversimplifying and inspire action with integrity.
Imagine new ways forward.
#SeeingClimate
28.01.2026 11:01
👍 17
🔁 5
💬 0
📌 0
It's official 🎉
Visualising Climate 2026 is here! visualisingclimate.com
First international conference of its kind, it'll bring together artists, scientists, journalists all moved by the same desire to better communicate our changing climate 🌍
🗓️ Join us in Bologna, Nov 4-6
#dataviz #climatecrisis
28.01.2026 13:17
👍 55
🔁 27
💬 1
📌 1
Several international organisations all released their global temperature updates today. In addition to our @copernicusecmwf.bsky.social Global Climate Highlights, here’s a thread with resources from WMO, the Met Office, Berkeley Earth, NASA, NOAA and more 📈🌡️⬇️
14.01.2026 14:45
👍 2
🔁 0
💬 0
📌 0

In the @copernicusecmwf.bsky.social Global Climate Highlights 2025 report we used #dataviz to present its key messages and bring them to a wider audience. This first example shows daily temperature anomalies from 1940 to 2025 and it was inspired by the work of @erwanrivault.com (BBC)
14.01.2026 13:58
👍 51
🔁 33
💬 3
📌 2

Globally, no single day in 2025 was cooler than its 1991-2020 average.
climate.copernicus.eu/global-clima...
14.01.2026 12:44
👍 1013
🔁 681
💬 20
📌 74

A figure from the global climate highlights report (figure 11) showing two maps of the globe, one with anomalies in the number of days with at least strong heat stress, and the other with anomalies in the number of days with at least strong cold stress, in 2025.
For @copernicusecmwf.bsky.social Global Climate Highlights, I used our Thermal Trace app to investigate heat and cold stress in 2025
🥵🥶Half the world saw more strong heat stress than average while most regions saw less cold stress
GCH: tinyurl.com/gch-2025
Thermal Trace: tinyurl.com/thermal-trace
14.01.2026 12:10
👍 2
🔁 0
💬 0
📌 0
Our latest @copernicusecmwf.bsky.social Global Climate Highlights 2025 report is out now.
2025 was our planet's third-warmest year on record ⚠️ and 2023–2025 stands apart from all previous years.
Why? To find out, I encourage everyone to explore the report: climate.copernicus.eu/global-clima...
14.01.2026 11:58
👍 1
🔁 0
💬 0
📌 0
SSHWS category is assigned using ONE value: the maximum wind 10 meters above the ocean surface averaged over 1 minute. A hurricane is not a point. Its size (extent of its wind *field*), forward speed, rainfall, potential storm surge, and the landscape it traverses all factor into its impacts. [3/5]
29.10.2025 14:09
👍 24
🔁 3
💬 1
📌 0
As a meteorologist with a 20-year obsession with hurricanes (thanks to Charley in 2004), who has done research and diagnostics on tropical cyclone forecasting and now works in climate science / learning about attribution, this is a very interesting thread about Hurricane Melissa ⬇️🧵🌀
31.10.2025 15:32
👍 3
🔁 1
💬 0
📌 0
I was lucky enough to spend some time recently learning how to make fused glass art - and was so excited to use @annalombardi.bsky.social’s beautiful data viz from the cover of #ESOTC2024 as inspiration for a glass creation! Grateful to work with someone so wonderful, supportive and inspiring ☺️ ☁️☀️
20.10.2025 18:43
👍 4
🔁 0
💬 0
📌 0
I had a lot of fun making these - I find your beautiful data viz so inspiring, both for storytelling / climate communications and for creating art 😄🥰 a pleasure to work with you always @annalombardi.bsky.social!
20.10.2025 18:38
👍 3
🔁 0
💬 0
📌 0
NWS Norman just issued their 1,112th Severe Thunderstorm Warning this year, which is now ~12% higher than their previous year's max of 988. (Glad VTEC implemented 4 digit tracking event numbers!)
23.09.2025 20:35
👍 15
🔁 6
💬 1
📌 1
A decade of C3S monthly climate bulletins with updates monitoring temperature, hydro variables & sea ice 🌡️💧🧊
I joined the team 3 years ago & I’m grateful to work with such an inspiring + dedicated team!
Curious who’s behind the C3S climate info you might’ve spotted in the news? “Meet” our team ⬇️
15.09.2025 20:53
👍 5
🔁 1
💬 0
📌 0
Celebrating 10 years of monthly climate updates! Since 2015, the #C3S Climate Bulletin has delivered timely and concise information about our climate to a global audience.
Read the story behind the data: climate.copernicus.eu/celebrating-...
#CopernicusClimate
12.09.2025 08:53
👍 36
🔁 17
💬 1
📌 0
During the heatwave in western Europe in August, maximum feels-like temperatures reached up to 45°C in France, 47°C in Portugal, and 49°C in Spain – the threshold for ‘extreme heat stress’ is 46°C 🥵
Based on insights from Thermal Trace, our new app for monitoring heat and cold stress worldwide 🔗⬇️
09.09.2025 22:00
👍 9
🔁 3
💬 1
📌 0
Factcheck: 16 misleading myths about solar power
✍️ @joshgabbatiss.bsky.social @mollylempriere.carbonbrief.org
🎨 @tomoprater.carbonbrief.org @jjgoodman.bsky.social Tom Pearson
Read here: buff.ly/47kIjiZ
03.09.2025 12:30
👍 44
🔁 22
💬 0
📌 5
Summer 2025 is the warmest on record for the UK
Provisional Met Office statistics confirm that summer 2025 is officially the warmest summer on record for the UK.
Met Office stats confirm summer 2025 is officially the warmest summer on record for the UK.
The UK’s mean temp of 16.10°C surpasses the previous record of 15.76°C and pushes the summer of 1976 out of the top 5 warmest summers.
www.metoffice.gov.uk/about-us/new...
01.09.2025 15:36
👍 163
🔁 74
💬 10
📌 15
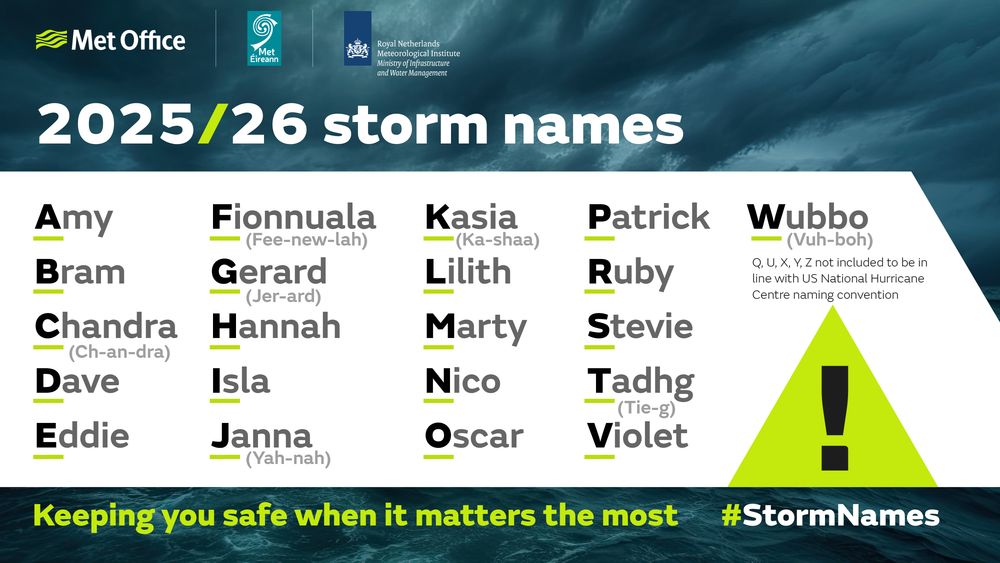
Amy, Bram, Chandra (Ch-an-dra), Dave, Eddie, Fionnuala (Fee-new-lah), Gerard (Jer-ard), Hannah, Isla, Janna (Yah-nah), Kasia (Ka-shaa), Lilith, Marty, Nico, Oscar, Patrick, Ruby, Stevie, Tadhg (Tie-g), Violet, Wubbo (Vuh-boh)
Keeping you safe when it matters the most.
Latest storm names announced❗
Here are the #StormNames for 2025/26, announced with Met Eireann and KNMI, the Dutch National Weather Service. Has your name made the list?
01.09.2025 04:00
👍 116
🔁 43
💬 26
📌 136


📈 Thermal Trace map shows feels-like temps reaching 46°C in Spain on 15 August - @rebeccalize.bsky.social , #C3S
📈 July 2025 temperature anomalies in the Arctic circle - ACCAP
📈 Highest temperature of 2025 (May 1 through Aug 15) in North America - Brian Brettschneider
29.08.2025 07:38
👍 29
🔁 14
💬 1
📌 4

1
Rising temperatures mean heat stress is becoming a growing health risk — especially in Europe. What causes heat stress and how do we monitor it? Explore the science in our article
🔗 climate.copernicus.eu/heat-stress-...
#C3S
28.08.2025 12:30
👍 17
🔁 10
💬 0
📌 1


Ever wondered how heat stress is changing where you live? With the new Thermal Trace app from #CopernicusClimate and #ECMWF, you can explore “feels-like” temperatures, track heat stress categories and thresholds, and visualise interactive charts for your city.
27.08.2025 13:29
👍 18
🔁 9
💬 2
📌 0
In recent days, southern Europe has faced heatwaves ☀️ Thermal Trace maps show feels-like temps reaching 46°C – the ‘extreme heat stress’ threshold – in Spain on 14-15 August and 47°C on 11-12 August 🥵 In SW France, feels-like temps reached 45°C – that's up to 14°C above average! 🌡️
Find out more ⬇️
20.08.2025 09:21
👍 37
🔁 18
💬 2
📌 0

🥁OUT NOW | The first signs of Africa’s solar take-off are in, as the continent’s solar panel imports SURGED by 60% in the last 12 months☀️
While South Africa led the 2023 rise in solar panel imports, 20 other countries lead the way this time around 📈
https://loom.ly/IBLOSSw
26.08.2025 02:30
👍 29
🔁 8
💬 0
📌 1
Created by Luke Jerram and exhibiting at National Trust properties around the UK this summer ✨
24.08.2025 11:53
👍 0
🔁 0
💬 0
📌 0

Photo of the Helios art installation - a globe hanging in amongst the trees with a detailed image of the sun, lit up in the dark.

Close up photo of the Helios art installation - a globe hanging in amongst the trees with a detailed image of the sun, lit up in the dark.

A photo of Basildon Park from the front lawn
Visited Helios at Basildon Park - a 7 m installation of the Sun hanging among the trees in the grounds, and with soundscapes that are real recordings from space. 1 cm of the image on the sphere represents 2000 km on the surface of the Sun! 🤩☀️✨ #SciArt
24.08.2025 11:49
👍 4
🔁 0
💬 1
📌 0

🌡️ Heatwaves are prolonged, intense periods of high temps, with serious consequences for health, agriculture, energy and water. Learn more about how heatwaves are defined, and how Europe is adapting. Read the article 🔗 climate.copernicus.eu/heatwaves-br...
22.08.2025 13:12
👍 30
🔁 21
💬 1
📌 1
Witnessing the rapid and extensive thawing of permafrost in Svalbard is truly impressive but deeply concerning
21.08.2025 16:17
👍 218
🔁 112
💬 7
📌 7


