And here's the NOAA CBRFC Powell inflows forecast page and 2026 forecast evolution plot: www.cbrfc.noaa.gov/dbdata/stati...
05.03.2026 18:40
👍 1
🔁 0
💬 0
📌 0
And here's the NOAA CBRFC Powell inflows forecast page and 2026 forecast evolution plot: www.cbrfc.noaa.gov/dbdata/stati...

Graph showing the NOAA Colorado Basin River Forecast Center's forecasts of April to July inflows to Lake Powell from 1991 to 2026, with colored lines showing how each season's forecast evolved from January through July. The latest Forecast, March 2026, is the lowest outlook for this time of year since at least 1991, at 36% of average inflows.
NOAA CBRFC's Mar 1st official forecast for Lake Powell April-July inflows is out, so here's an update of my "spaghetti" plot.
Despite better snowfall in February, the most-probable forecast remains bleak at 36% of average. Even an unusually wet Mar-May would only get us to ~65% of average.

The mountain snowpack so far this winter is in bad shape. Long-time Coloradans might remember two other terrible winters for snow: 1976-77 and 1980-81. Our latest blog post takes a look at how this year compares to those snow droughts of the past. #cowx

Graph showing the NOAA Colorado Basin River Forecast Center's forecasts of April to July inflows to Lake Powell from 1991 to 2026, with colored lines showing how each season's forecast evolved from January through July. The latest Forecast, February 2026, is the lowest outlook for this time of year since at least 1991.
Given the latest NOAA CBRFC inflow forecast for Lake Powell, I dusted off this plot from my Twitter days and updated it.
The Feb 1st outlook for Colorado River flows hasn't been this poor in >35 years. Even if wetter weather ahead, bottom-10 outcome likely.
h/t @glenwoodrek.bsky.social

Photograph of a large lenticular cloud with horizontal striations, lit up orange by the setting sun, hovering over the snowy mountains of Front Range of Colorado. Taken by Jeff Lukas in Fraser, Colorado in January 2019.
Looking E from Fraser, CO at the crest of the Front Range (Indian Peaks), January 2019; feel free to use w/ attribution

Map of the western U.S. showing the locations of about 1000 automatic snow-monitoring sites (SNOTELs), of which about 200 are filled in with red or orange, signifying that the water content of the snowpack is at its record-lowest or 2nd-lowest level for February 2nd. The red and orange sites are most prevalent in Colorado, Utah, Idaho, and Oregon.
Not good! If you haven't used the "Records" feature on the NRCS iMap, it's showing a further level of bleak: about half of the SNOTELs in CO and UT with >20-yr records are at their lowest (red) or 2nd-lowest (orange) SWE level for February 2.

The WH is pretty candid about the transactional nature of the move against NCAR.
www.notus.org/trump-white-...
The true "why?" of this story is a little buried: This is part of Trump's retaliation against CO Gov. Polis for his recent refusal to pardon state-convicted 2020 election conspirator Tina Peters. An egregiously impulsive and reckless move with far-reaching consequences for the nation.
Yeah Maynard! I grew up next door in slightly bigger Sudbury.
Upper San Juan SNOTEL is at 9.8" precip in ~100 hours as of 5am 10/14. Highest among the San Juan Mts SNOTELs, but 5 others are at >7" so far.
Yeah, the max 2" isohyet isn't cutting it for TC precip!
It was new to me that the 8.05" in 24h at Gladstone had been thrown under the bus, first in the paper you linked, and then by Ed T and Tye P: damsafety.org/content/revi...
Upper San Juan SNOTEL picked up 3.9" in 24h a few days ago.
Link: hermes.cde.state.co.us/islandora/ob... - p. 662-671 for the Oct 1911 storm
And ICMYI, this event is on the CO-NM REPS storm list as a Tropical storm (SPAS-1107; "Wagon Wheel, CO") with a grid max of 7.88" and obs max of 5.08".
This 1986 NWS tech memo on EPac storms that impacted SW US includes the Oct 1911 event, w/ hand-drawn TC track and details on the synoptic setup--see p. 23,25-26. www.weather.gov/media/wrh/on...
The TC itself has its own Wikipedia page as the "1911 Sonora hurricane."

Oh, this is heartbreaking. The 15 small businesses impacted represent a big chunk of Ned. A local realtor has a gofundme up: www.gofundme.com/f/aid-nederl...
Ack--that should be the NRCS National Water and Climate Center, NWCC
And FWIW, it's not even accurate--the Snow and Water Interactive Map is being updated with new obs from the SNOTEL observing networks. So either NRCS National Climate and Water Center staff are "essential" (I hope), or that their systems can run unattended, at least for a while.

Screenshot of a US Department of Agriculture website, the Snow and Water Interactive Map. A large text box at the top of the page reads "Due to the Radical Left Democrat shutdown, this government website will not be updated during the funding lapse. President Trump has made it clear he wants to keep the government open and support those who feed, fuel, and clothe the American people."
In case you were wondering, this is a completely normal way for a federal department (Agriculture) to communicate the status of its online services during a government shutdown.
Amen.
As a reader: "Talent" is well supported by the evidence :)
Kathie, congrats on the new role!
Shit, this is sad to see. The ABQ bosque is a wonderful oasis for all the local biota, human and non-human.
Can confirm. Zero mentions of the Fundamental Thing That Can Not Be Named.
Also, 'change(s)' is used in the context of weather and climate all of two times.
Yeah, the deliberate conflation of (a) commercial LLMs with billions of parameters that handle millions of queries daily with (b) far smaller ML models tuned for very specific science and engineering tasks, in order to pose "AI" as a climate necessity--that's pretty egregious.
Yikes. It's currently 25.5 C in my upstairs home office, and I'm feeling sluggish enough that I'll kick the A/C on soon. Can't be a good thing to spend entire school days in rooms hotter than this. (To say nothing of the indoor air quality.)
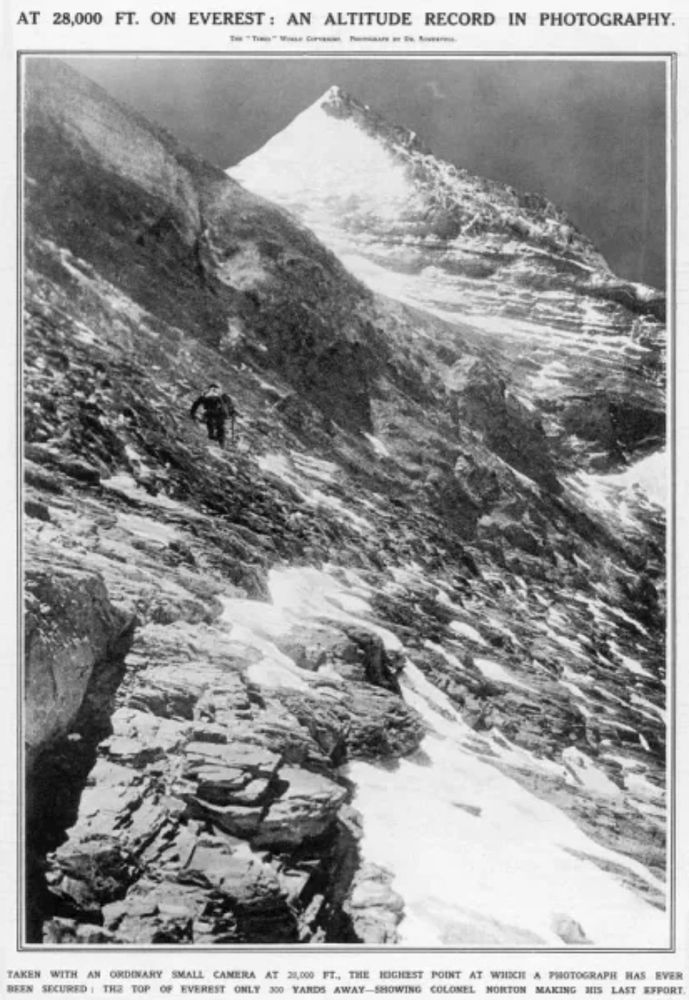
Black and white photograph of the rocky and steep upper North Face of Mount Everest showing mountaineer Edward Norton carefully traversing the slope in the middle ground, with the snowy summit in the background. Photo taken on the 1924 Everest expedition by Howard Somervell.
Had no idea Somervell was an accomplished painter! He also took one of the greatest mountaineering photographs of all time, on the 1924 Everest expedition, of teammate Edward Norton near his high point of 28,126'. Still had an amazing eye for composition while oxygen-deprived and exhausted.
This is fucking insane. Closing these NOAA labs would obliterate our ability to observe, understand, and forecast the Earth System, from weather systems tomorrow to sea levels 50 years from now.
Cooke wouldn't be the first Commissioner in recent decades to have come from a high-profile Basin-state job (Estevan Lopez), but this feels...different. Is WH/Interior signaling a tilt towards Lower Basin interests here?
Beyond that, very relieved it's someone who knows what the hell they're doing.
We've been in Lafayette since 2021, in Louisville for 5 years before that. Our lived experience matches the data--it's gotten a *lot* noisier. In addition to the increased flight-school traffic, it feels like the private/corporate jet flights have also jumped up.
Succinct illustration of increasing exposure leading to greater risk and loss.
This is in the southeast fringe of the Denver metro area, about 8 mi east of Parker.