Today is the last day to apply for two open roles on our team: Assistant Director, Education & Training AND Project Manager!
Learn more and apply here:
jobs.nebraska.edu/UniversityNe...
jobs.nebraska.edu/UniversityNe...
12.01.2026 15:30
👍 0
🔁 0
💬 0
📌 0

High school GPA of ACE participants line chart and graduation rate of ACE participants donut chart.
ACE participants maintain similar GPAs to non‑ACE dual‑enrollment students and higher GPAs than non‑dual‑enrollment students. ACE participants had a high overall high school graduation rate of 98%.
Read the ACE report here: insights.nswers.org/evaluations/....
06.01.2026 15:57
👍 0
🔁 0
💬 0
📌 0

ACE participants by sex donut chart and ACE participants by race/ethnicity horizontal bar chart.
About 65% of Nebraska ACE participants are female. Roughly half of the participants are White, with strong representation from Hispanic students.
Read more here: insights.nswers.org/evaluations/....
06.01.2026 15:51
👍 0
🔁 0
💬 0
📌 0

We are hiring an assistant director of education and training.
We’re hiring! 📣
NSWERS is seeking an Assistant Director of Education & Training to support impactful education & workforce initiatives across Nebraska.
Learn more & apply: jobs.nebraska.edu/UniversityNe....
30.12.2025 20:33
👍 0
🔁 0
💬 0
📌 0

Map of urban and rural classification of Nebraska counties and bar chart of ACE scholarship recipients by urban and rural county from 2017 to 2023.
Did you know more than two‑thirds of ACE scholarship recipients are from urban Nebraska counties? Yet, the participation rate in rural counties is comparatively high given that Nebraska’s youth population is concentrated in urban areas. Read more here: insights.nswers.org/evaluations/....
22.12.2025 20:16
👍 0
🔁 0
💬 0
📌 0

We are hiring a project manager!
We’re hiring! 📣
NSWERS is looking for a skilled Project Manager to help lead impactful, data-driven work supporting education and workforce decisions in Nebraska.
Apply here: jobs.nebraska.edu/UniversityNe....
22.12.2025 20:02
👍 0
🔁 0
💬 0
📌 0

Line chart of top 10 Nebraska ACE scholarship participating postsecondary institutions from 2017 to 2023.
More than half of Nebraska ACE scholarship recipients enroll in dual enrollment courses through community colleges.
For more about Nebraska ACE scholars, read the program evaluation here: insights.nswers.org/evaluations/....
19.12.2025 18:17
👍 0
🔁 0
💬 0
📌 0

Bar chart of top 10 course subjects enrolled by ACE scholarship recipients from 2017 to 2023.
The total number of courses enrolled in and completed by Nebraska ACE scholarship recipients has increased over time. English was the most frequently enrolled subject, followed by mathematics and history.
Read more about the ACE scholars: insights.nswers.org/evaluations/....
18.12.2025 14:52
👍 0
🔁 0
💬 0
📌 0

Line chart of ACE recipients and scholarships awarded from 2018 to 2023.
The number of Nebraska ACE scholarships awarded has increased steadily over time, while the number of ACE scholarship recipients has remained relatively constant. Read the full report on ACE scholars here: insights.nswers.org/evaluations/....
17.12.2025 14:40
👍 0
🔁 0
💬 0
📌 0

2025 ACE Scholarship Program Evaluation
Today NSWERS released a comprehensive evaluation of the Access College Early (ACE) Scholarship Program, offering the most detailed analysis to date of student participation, demographics & postsecondary outcomes.
Read the full report here: insights.nswers.org/evaluations/....
16.12.2025 16:07
👍 0
🔁 0
💬 0
📌 0

Student chronic absenteeism and college-going behavior for Nebraska public school graduates bar chart.
A gap in college going exists between chronic absentees & their peers, where 70.9% of graduates who regularly attend school enroll in a postsecondary institution compared to 48.7% of chronically-absent peers. To learn more, visit: insights.nswers.org/briefs/2025-....
10.11.2025 16:29
👍 0
🔁 0
💬 0
📌 0

Graduation rate and chronic absenteeism for Nebraska public high school students in 2021 through 2024 bar chart.
Nebraska public high school seniors who are chronically absent graduate at rates 16.3 percentage points lower than their peers who are not chronically absent. For more information on chronic absenteeism in Nebraska, visit: insights.nswers.org/briefs/2025-....
07.11.2025 14:31
👍 0
🔁 0
💬 0
📌 0

Statewide Assessment Proficiency of Nebraska Public School Students by Grade Level, Subject and Chronic Absenteeism series of bar charts for the 2023-2024 academic year.
Divides in Nebraska statewide assessment proficiencies for science, math & English prevail between chronically-absent students and their non-chronic absentee peers. See more: insights.nswers.org/briefs/2025-....
04.11.2025 14:54
👍 0
🔁 0
💬 0
📌 0

Chronic Absenteeism by Student Characteristics for Nebraska Public School Students bar chart.
While differences in chronic absences between student genders are minimal in Nebraska, disparities exist among student race/ethnicity and other student characteristics. To learn more about chronic absenteeism in Nebraska, visit: insights.nswers.org/briefs/2025-...
03.11.2025 15:25
👍 0
🔁 0
💬 0
📌 0

Chart for Chronic Absenteeism Rate for Nebraska Public School Students, 2011-2024
The percentage of students who were chronically absent steeply increased during the COVID-19 pandemic & leveled off in 2024, maintaining an average chronic absenteeism rate above 20% across Nebraska public school students. Learn more: insights.nswers.org/briefs/2025-....
30.10.2025 17:19
👍 0
🔁 0
💬 0
📌 0

https://insights.nswers.org/briefs/2025-chronic-absenteeism
NSWERS has released a new research brief examining chronic absenteeism in Nebraska’s K–12 schools and its effect on student outcomes, including assessment scores, graduation rates, and college enrollment. View the full brief here: insights.nswers.org/briefs/2025-....
07.10.2025 15:20
👍 1
🔁 1
💬 0
📌 0

Six-Month Sprint Story image https://insights.nswers.org/stories/six-month-sprint-timely-employment-in-nebraska/
NSWERS just released a NEW interactive scrollytelly story, "Six-Month Sprint," which highlights the critical six-month window Nebraska college graduates face as they transition from student to employee. Explore it here: insights.nswers.org/stories/six-...!
26.08.2025 16:06
👍 1
🔁 0
💬 0
📌 0

We are hiring a data engineer
📊 NSWERS is hiring a Data Engineer to ensure effective & secure application operations & create efficient & automated data processing routines & successful data integration with NSWERS partner organizations. For more information, and to apply, visit: jobs.nebraska.edu/UniversityNe....
14.08.2025 14:08
👍 0
🔁 0
💬 0
📌 0

We are hiring a back-end web developer image
💻NSWERS is hiring a Back-End Web Application Developer!💻 To apply, visit: jobs.nebraska.edu/UniversityNe....
12.08.2025 16:19
👍 0
🔁 0
💬 0
📌 0

NSWERS is growing & we are hiring an Executive Assistant to provide comprehensive support to the Executive Director & NSWERS leadership team!
For more information, and to apply, visit: jobs.nebraska.edu/UniversityNe....
06.08.2025 13:10
👍 0
🔁 0
💬 0
📌 0

https://jobs.nebraska.edu/UniversityNebraskaSystem/job/Data-Scientist%2C-Workforce-&-Education/708-en_US/.
We are excited to announce that‼️WE ARE HIRING‼️a data scientist! For more information, and to apply, visit: jobs.nebraska.edu/UniversityNe....
05.08.2025 18:37
👍 1
🔁 0
💬 0
📌 0

Want to know more about the education-to-workforce pipeline in Nebraska? Visit the NSWERS insights website, your go-to location for all education and workforce data in the state! insights.nswers.org
08.07.2025 15:05
👍 1
🔁 0
💬 0
📌 0
How do we keep students in Nebraska? This new scrollytelly story from NSWERS illustrates the important factors that shape talent retention in the state.
Explore the full story here: insights.nswers.org/stories/keep....
12.05.2025 14:05
👍 0
🔁 0
💬 0
📌 0

Three students in Nebraska.
A new NSWERS scrollytelly story brings to life the fictional journeys of three college students navigating education, work, and the pivotal decision of whether to stay in Nebraska after graduation. Experience the full story here: insights.nswers.org/stories/keep....
29.04.2025 16:07
👍 0
🔁 0
💬 0
📌 0
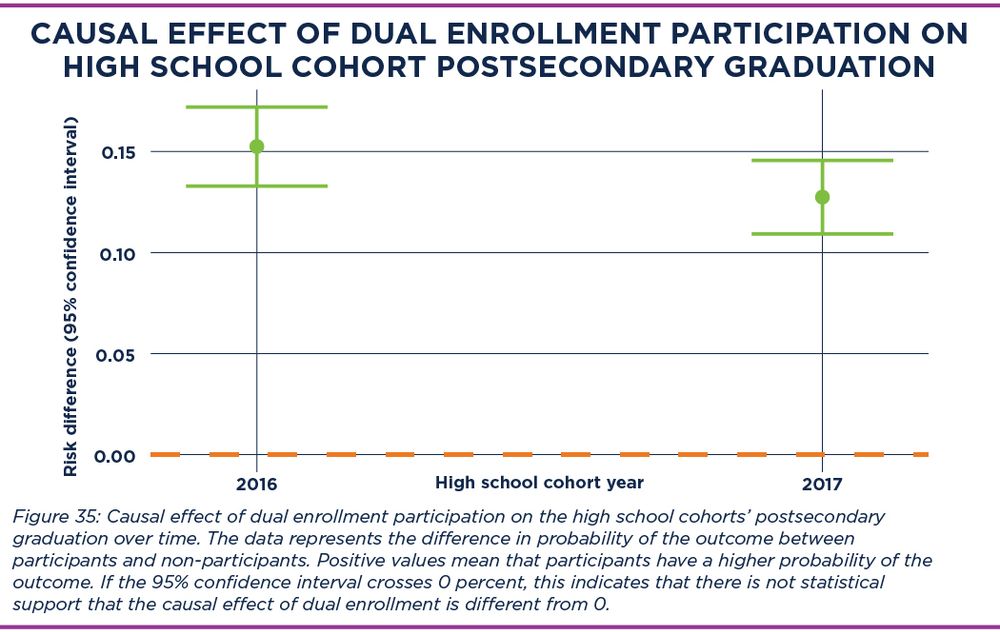
Dot and whisker plot of the causal effect of dual enrollment participation on postsecondary graduation.
Dual enrollment participants in Nebraska are 13 percentage points more likely to attain a postsecondary degree within six years of high school graduation than those who do not participate. Read more about dual enrollment in Nebraska: insights.nswers.org/special-repo....
18.04.2025 14:09
👍 0
🔁 0
💬 0
📌 0
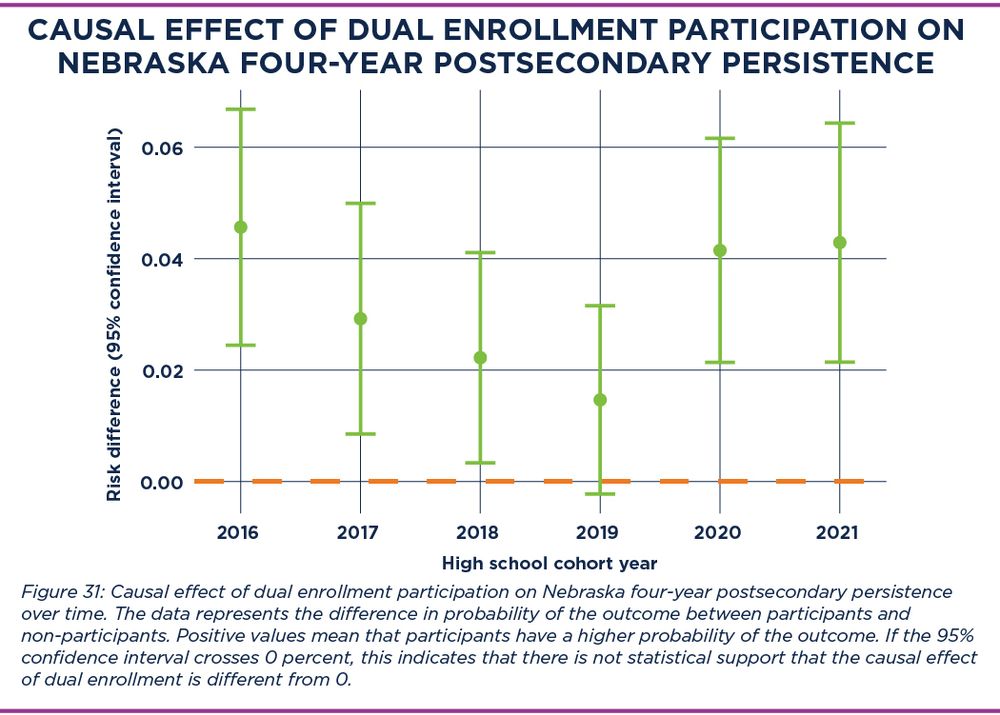
Dot and whisker plot of the causal effect of dual enrollment participation on Nebraska four-year postsecondary persistence.
At four-year Nebraska-based institutions, college persistence rates were four percentage points higher for those who participated in dual enrollment than those who did not. Learn more about dual enrollment in Nebraska: insights.nswers.org/special-repo....
17.04.2025 21:15
👍 0
🔁 0
💬 0
📌 0
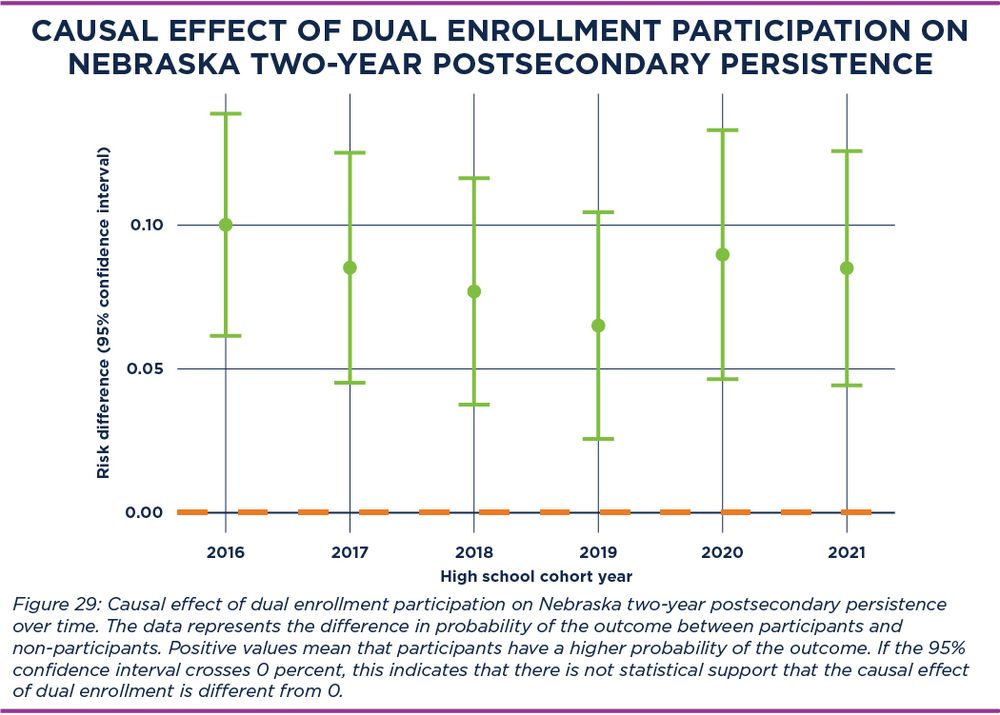
Dot and whisker plot of the causal effect of dual enrollment participation on Nebraska two-year postsecondary persistence.
College persistence rates are greater at Nebraska-based institutions for those who participated in dual enrollment than those who did not. In fact, 9 percentage points higher at two-year colleges! Read more: insights.nswers.org/special-repo....
17.04.2025 14:05
👍 0
🔁 0
💬 0
📌 0
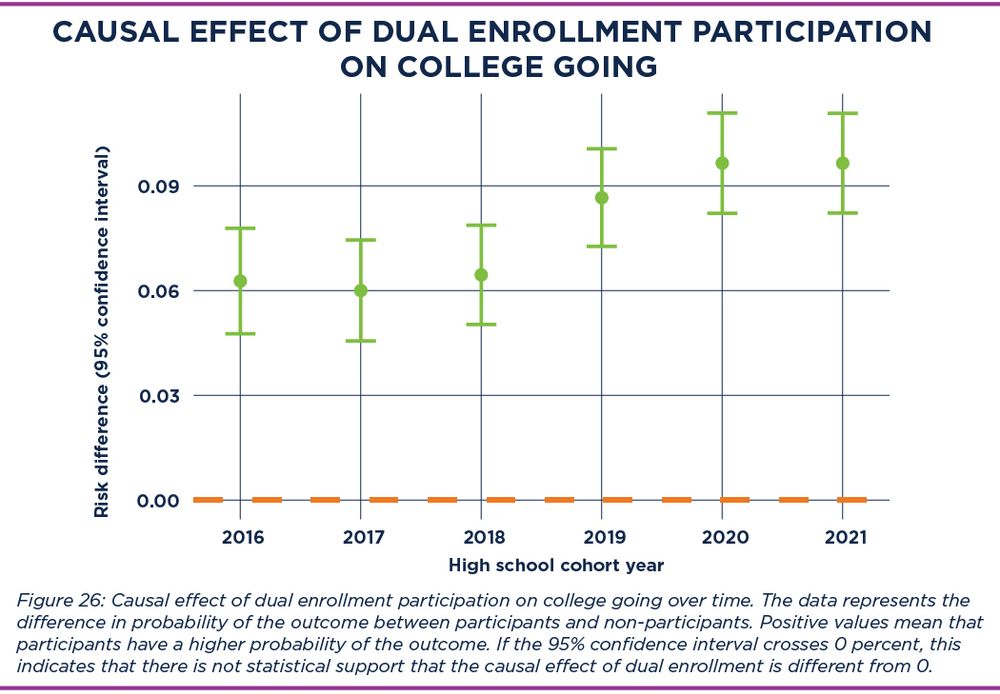
Dot and whisker plot of causal effect of dual enrollment participation on college going.
Nebraska dual enrollment participants are 10 percentage points more likely to enroll in college within 16 months of high school graduation than those who do not participate. Read more about dual enrollment in Nebraska: insights.nswers.org/special-repo....
16.04.2025 18:36
👍 0
🔁 0
💬 0
📌 0
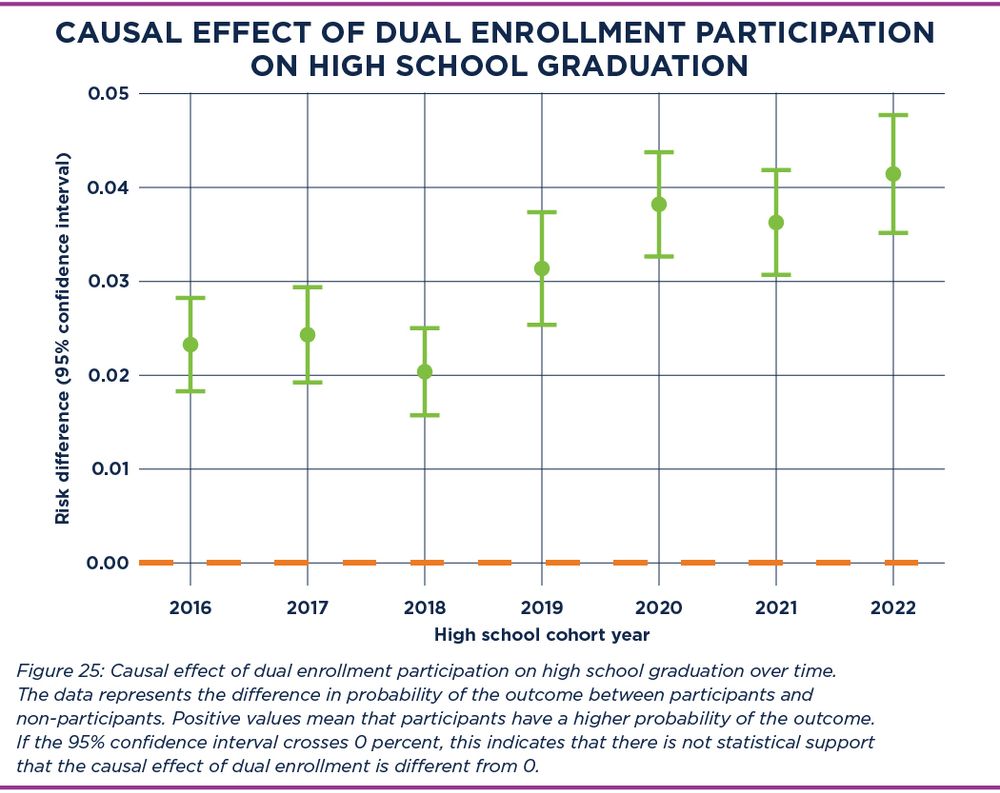
Dot and whisker plot of the causal effect of dual enrollment participation on high school graduation from 2016 to 2022.
Dual enrollment participants in Nebraska are 4 percentage points more likely to graduate high school on time than non-participants. Read more about dual enrollment in Nebraska: insights.nswers.org/special-repo....
15.04.2025 15:59
👍 0
🔁 0
💬 0
📌 0
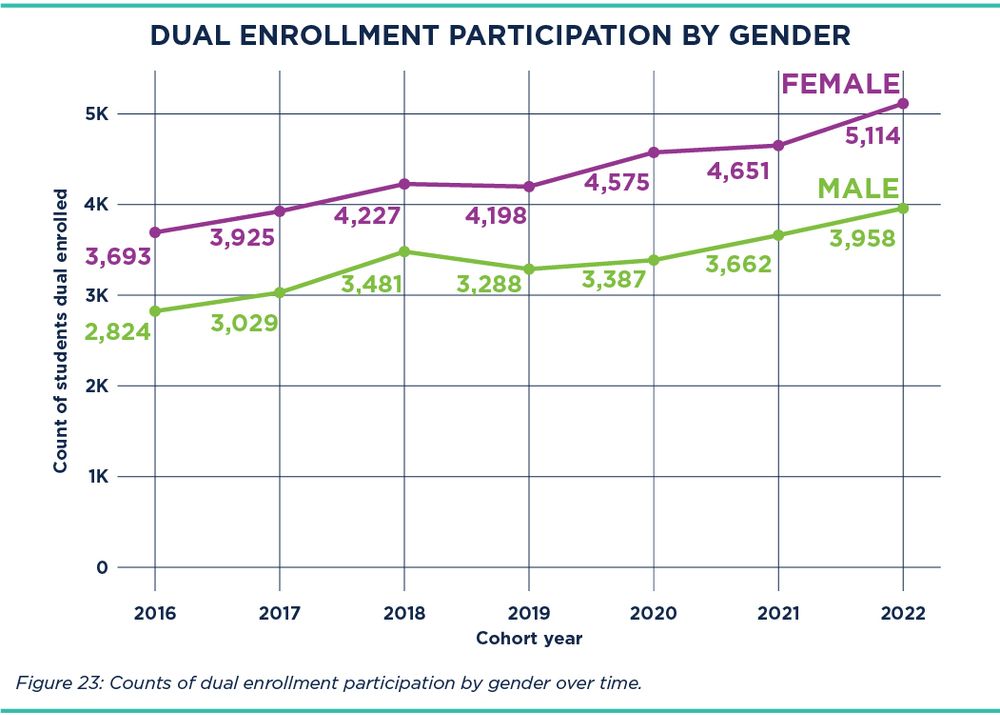
Line chart of dual enrollment participation by gender from 2016 to 2022.
Female students are more likely to participate in dual enrollment in Nebraska than male students (56% versus 44%) and this gender gap continues over time. Read more about dual enrollment in Nebraska: insights.nswers.org/special-repo....
14.04.2025 19:43
👍 0
🔁 0
💬 0
📌 0