Who is ready for #PAA2026?! 🤝 🎤 📈
The preliminary program is now online: buff.ly/hvP9w37
3 days of oral sessions, posters, exhibits, networking, population data, research and feedback. What are you looking forward to the most?
Get registered: buff.ly/GDo7YDm
24.02.2026 21:30
👍 10
🔁 4
💬 0
📌 1

Screenshot of website for publication 54-11
LGBTQ+ adults in the US have distinct partnership and living arrangements often missed in surveys: less often married, more likely to cohabit or have non-coresidential partners, and more likely to live alone, with roommates, or in smaller households.
www.demographic-research.org/articles/vol...
17.02.2026 08:13
👍 26
🔁 11
💬 1
📌 2

Our new research shows that hundreds of federal surveys removed questions about sexual orientation and gender identity since the start of the second Trump administration. Read the full report at: tinyurl.com/SOGIdata
17.02.2026 19:00
👍 16
🔁 16
💬 0
📌 6
Measuring Food Security with U.S. Federal Data – Use It for Good
Did you hear the USDA plans to cease data collection for the CPS Food Security supplement? We have a blog post to give you more information. If you want to sign a letter asking for data collection to continue, see the threaded opportunities below. blog.popdata.org/food-securit...
21.10.2025 16:00
👍 9
🔁 9
💬 2
📌 1
Individual Sign-on to PAA FFS Letter
Please click the link to complete this form.
Join letter to congressional leaders rejecting USDA's decision to halt data collection and release of food security reports. Support restoring funding for the Food Security Supplement in the Current Population Survey.
Individuals: buff.ly/m2pb60w
Organizations: buff.ly/VLQjNjg
15.10.2025 13:39
👍 9
🔁 6
💬 0
📌 3

Remembering Matthew Shepard, Dec. 1, 1976 to Oct. 12, 1998. IMAGE: A black and white image of Matthew Shepard, a rainbow in the background.
On this day in 1998, Matthew Shepard died after being attacked in a brutal, anti-gay hate crime. He should still be alive today.
In honor of Matthew's memory, we will always fight to both end anti-LGBTQI+ violence and build a safer, more inclusive future.
12.10.2025 14:18
👍 142
🔁 40
💬 4
📌 3

4 days left! Submit your work by Sunday, Oct. 5. Join demographers and social and health scientists at all career stages, from the US and abroad, next May in St. Louis, Missouri for #PAA2026. buff.ly/HoZlR1U
01.10.2025 11:30
👍 8
🔁 2
💬 0
📌 1

The top 5 reasons to attend #PAA2026. Repost THIS with YOUR #1 reason to come to the premier conference of demographers and social and health scientists from the United States and abroad. buff.ly/3KR6NRM
23.09.2025 15:03
👍 3
🔁 1
💬 0
📌 1
So many reasons to come to #PAA2026: 1) the best place to receive feedback from peers and interdisciplinary scholars 2) hearing latest research, methods, ideas from colleagues 3) the community 🫶 Attendees keep coming back year after year! Submit your work by Oct. 5. buff.ly/3KR6NRM
22.09.2025 16:45
👍 6
🔁 3
💬 0
📌 1
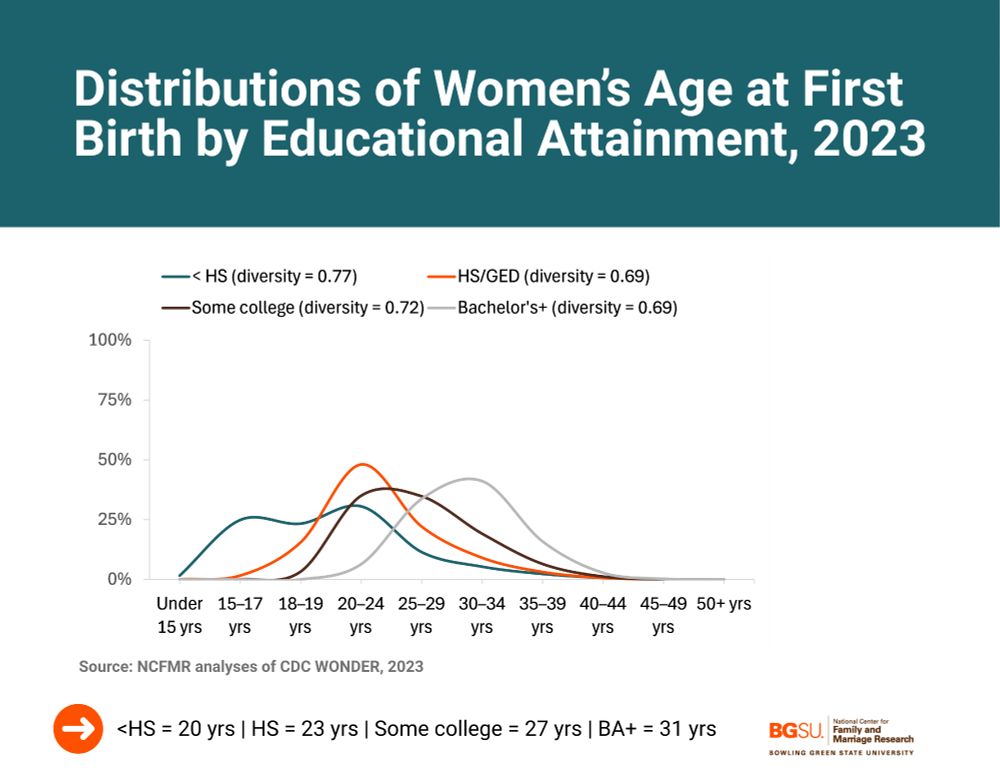
👶 In 1960, most women had their first child by age 22. By 2023, the median was 27. Education plays a role: <HS = 20 yrs vs BA+ = 31 yrs. 📖 See the new @NCFMR Profile → doi.org/10.25035/ncf...
08.09.2025 13:37
👍 7
🔁 3
💬 0
📌 0

Hard at work on your #PAA2026 submission? The deadline is in 3 weeks! Submit your work by Sunday, Oct. 5. buff.ly/Uu9sG50
14.09.2025 14:45
👍 5
🔁 3
💬 0
📌 0

The submission site is now open! Submit your work to #PAA2026 — Deadline is Sunday, October 5. www.populationassociation.org/paa2026/call...
18.08.2025 17:41
👍 10
🔁 11
💬 0
📌 1
Half of the Picture: A Research Note on Measuring the Sexual Identity Composition of Couples | Demography | Duke University Press
10.9% couples include at least one sexually diverse partner—twice+ rate seen when only one partner’s identity is counted. Most bi & multi-identity individuals have het partners; g/l & straight adults often partner within their identity. #SOGIData
@chrisajulian.bsky.social @wendymanning.bsky.social
14.08.2025 13:31
👍 18
🔁 6
💬 1
📌 2
Half of the Picture: A Research Note on Measuring the Sexual Identity Composition of Couples | Demography | Duke University Press
Check out our new paper using @nchatstudy.bsky.social dyadic data to measure sexual minority couples. The levels are twice as high when you consider the sexual identity of BOTH members of the couple. @chrisajulian.bsky.social
read.dukeupress.edu/demography/a...
08.08.2025 15:44
👍 11
🔁 3
💬 0
📌 0

@chrisajulian.bsky.social et al, in “Half of the Picture: Measuring the Sexual Identity Composition of Couples,” employ @nchatstudy.bsky.social dyadic data to provide national estimates of the sexual identity composition of couples using both partners’ identities. read.dukeupress.edu/demography/a...
08.08.2025 15:50
👍 10
🔁 2
💬 1
📌 0

A teal, gold, and beige horizontal bar chart showing that LGBTQ and non-LGBTQ adults are about equally likely to say they want to get married someday
LGBTQ and non-LGBTQ adults under 50 are about equally likely to say they want to get married someday.
12.08.2025 17:31
👍 20
🔁 6
💬 1
📌 0
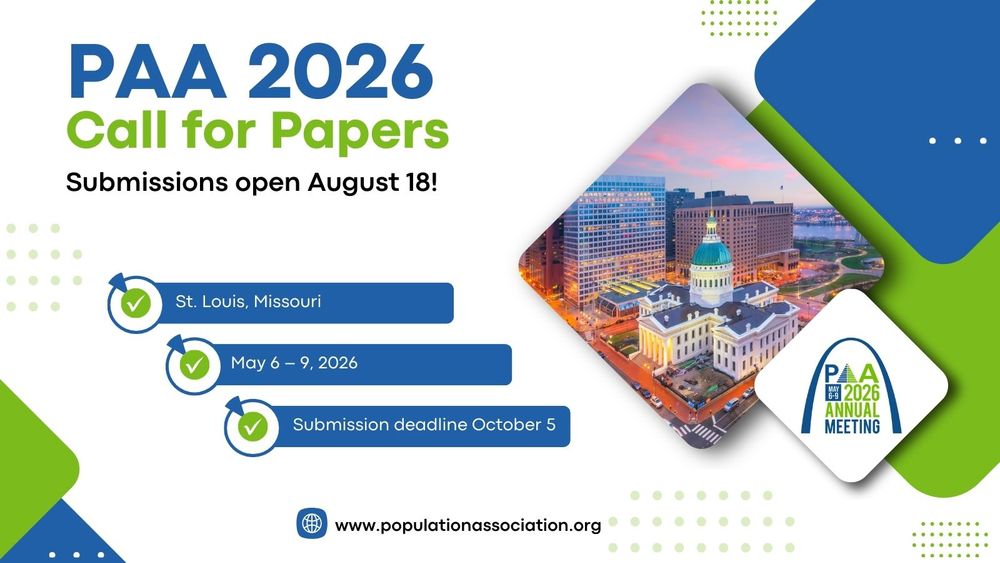
We are excited to announce the #PAA2026 Call for Papers is now available! The submission site opens on Monday, Aug. 18 and the deadline is Sunday, Oct. 5. Meet me in St. Louis! May 6-9, 2026:
www.populationassociation.org/paa2026/call...
12.08.2025 19:31
👍 36
🔁 18
💬 1
📌 11

Wisconsin Supreme Court Clears Way to Ban Conversion Therapy
The state Supreme Court delivered a huge win for LGBTQ people.
In case you missed it: the Wisconsin Supreme Court just upheld a ban on conversion therapy. Huge win for LGBTQ rights.
newrepublic.com/post/197704/...
09.07.2025 15:20
👍 8907
🔁 1659
💬 61
📌 113

What Are SNAP Benefits, and How Might They Change?
Our new study finds that almost seven in 10 LGBT adults who received SNAP benefits had household incomes under $35,000, two-thirds were living with a disability, and nearly half had a child under 18 living in their household. bit.ly/LGBTSNAP
02.07.2025 19:48
👍 6
🔁 2
💬 0
📌 0
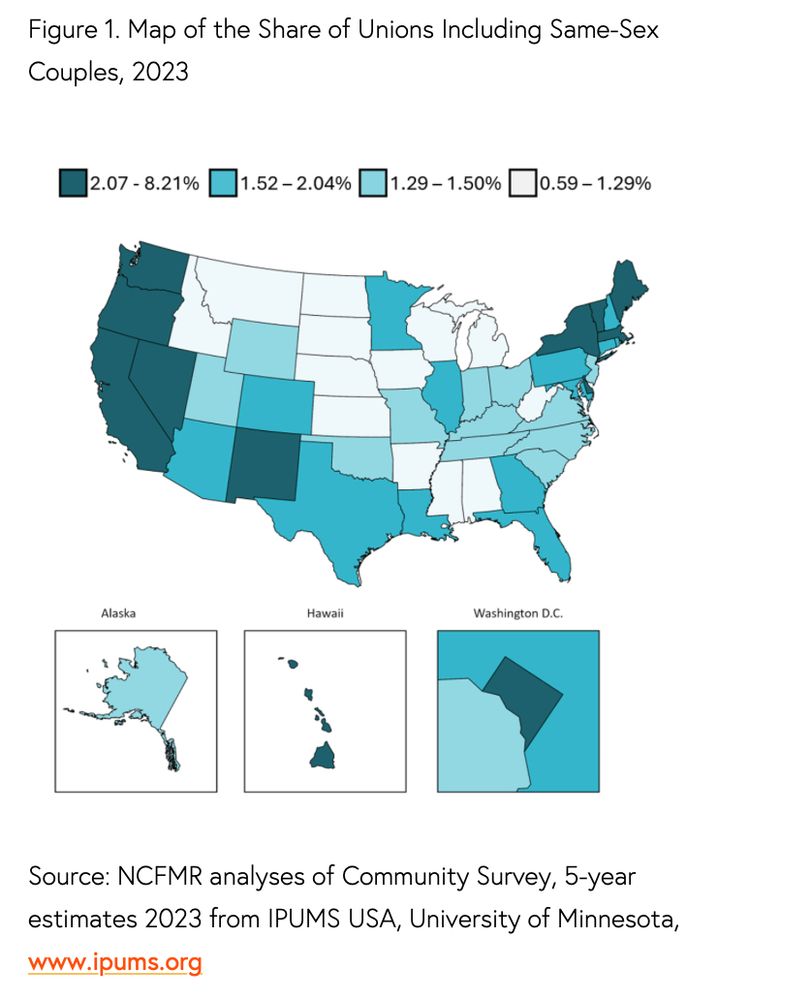
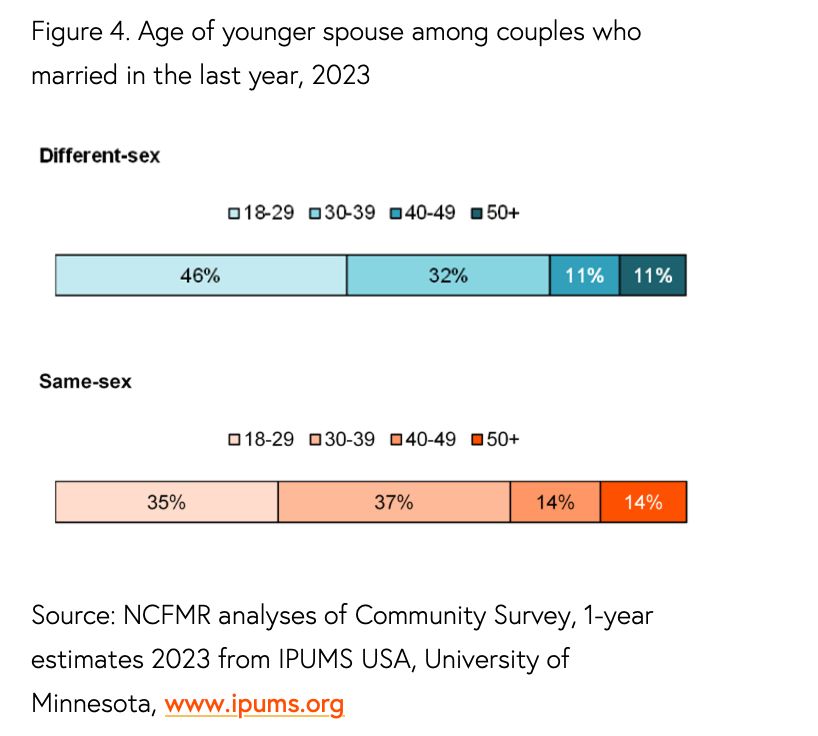
The share of same-sex couples was highest in Washington, D.C. (8.21%), followed by Vermont at 2.70%. The state with the lowest share of same-sex couples was South Dakota (0.59%). Learn more in our latest Family Profile: doi.org/10.25035/ncf....
02.07.2025 12:53
👍 3
🔁 2
💬 0
📌 0

The Family and the LGBTQ Population
Over the past two decades, attention to LGBTQ+ adults and their families in the U.S. has grown significantly due to advocacy movements, policy debates, and improved data collection. Early U.S. Census ...
In honor of today, check out this #freshout grand review of the demographic LGBT family lit. From data gains to persistent gaps, we trace how family structures, identities, and outcomes are (and aren’t) captured in mainstream research. #LGBTQ #Demography #FamilyStudies w/ @chrisajulian.bsky.social
26.06.2025 14:47
👍 15
🔁 6
💬 0
📌 0
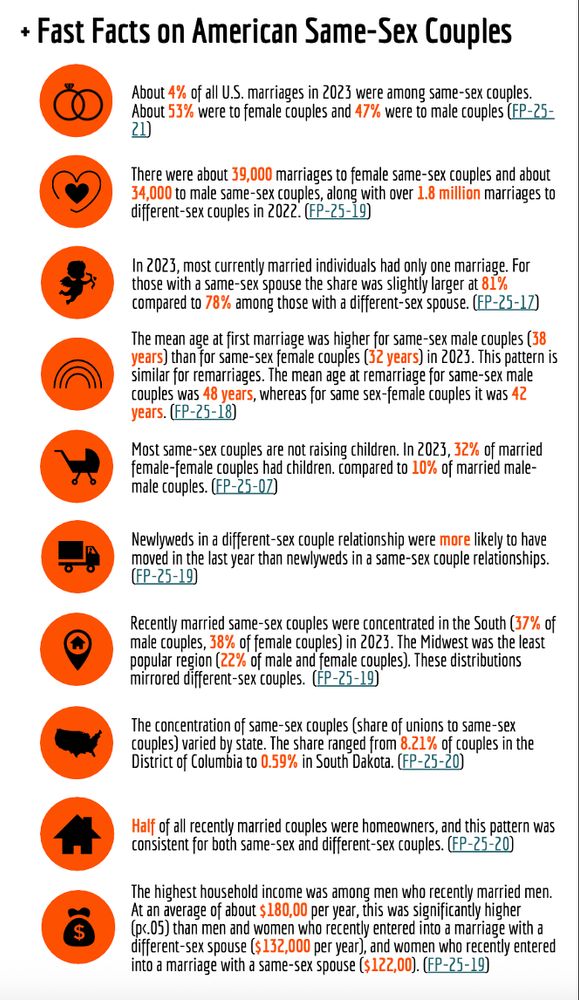
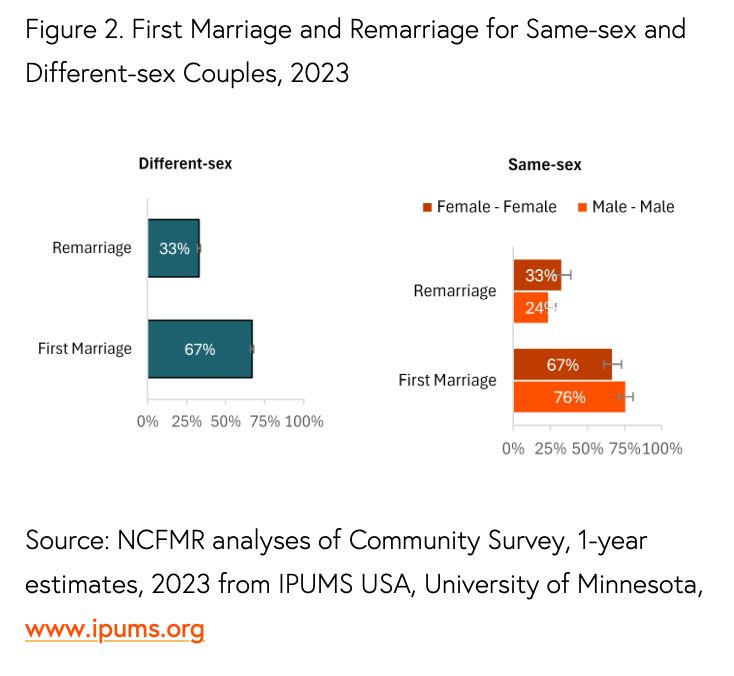
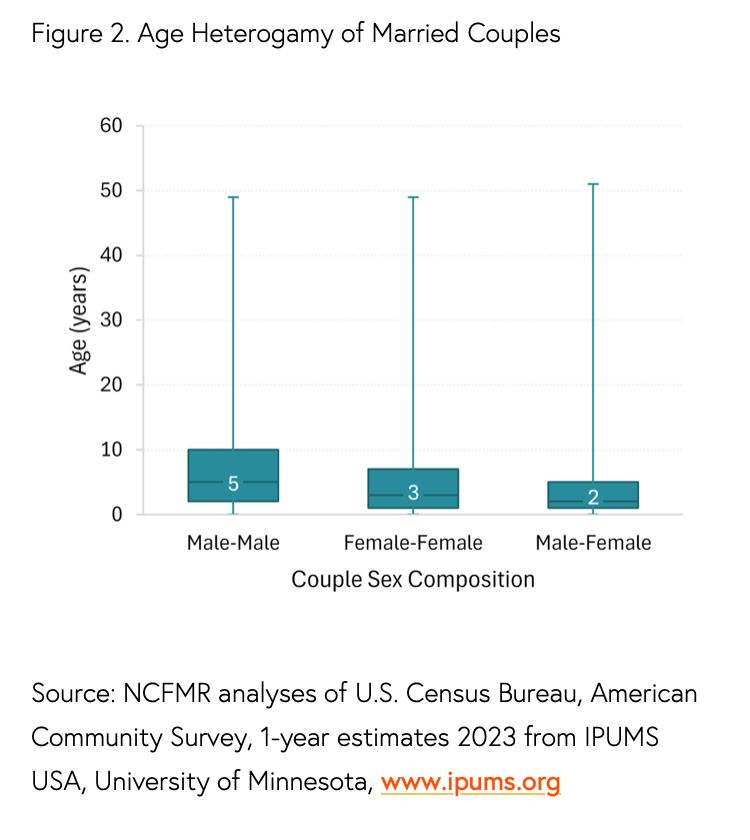
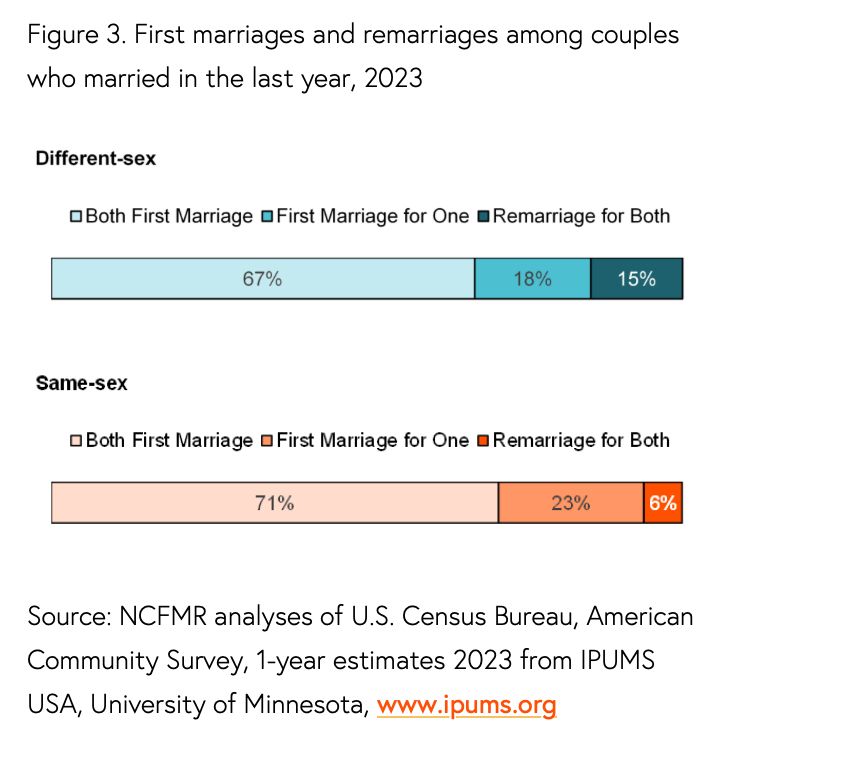
Today marks the 10th anniversary of Obergefell v. Hodges. Explore our Fast Facts on same-sex couples and dive into our latest Family Profiles highlighting same-sex families: www.bgsu.edu/ncfmr/resour....
26.06.2025 11:21
👍 6
🔁 4
💬 0
📌 0

Second International Handbook on the Demography of Sexuality
This 2nd edition of the International Handbook on the Demography of Sexuality provides new insight into the developing field of demography of sexuality
My new edited book with Zelma Oyarvide Tuthill is now out - the Second International Handbook on the Demography of Sexuality. Thank you to all chapter authors for your wonderful contributions to the #demographyofsexuality!
20.06.2025 16:23
👍 11
🔁 4
💬 0
📌 0
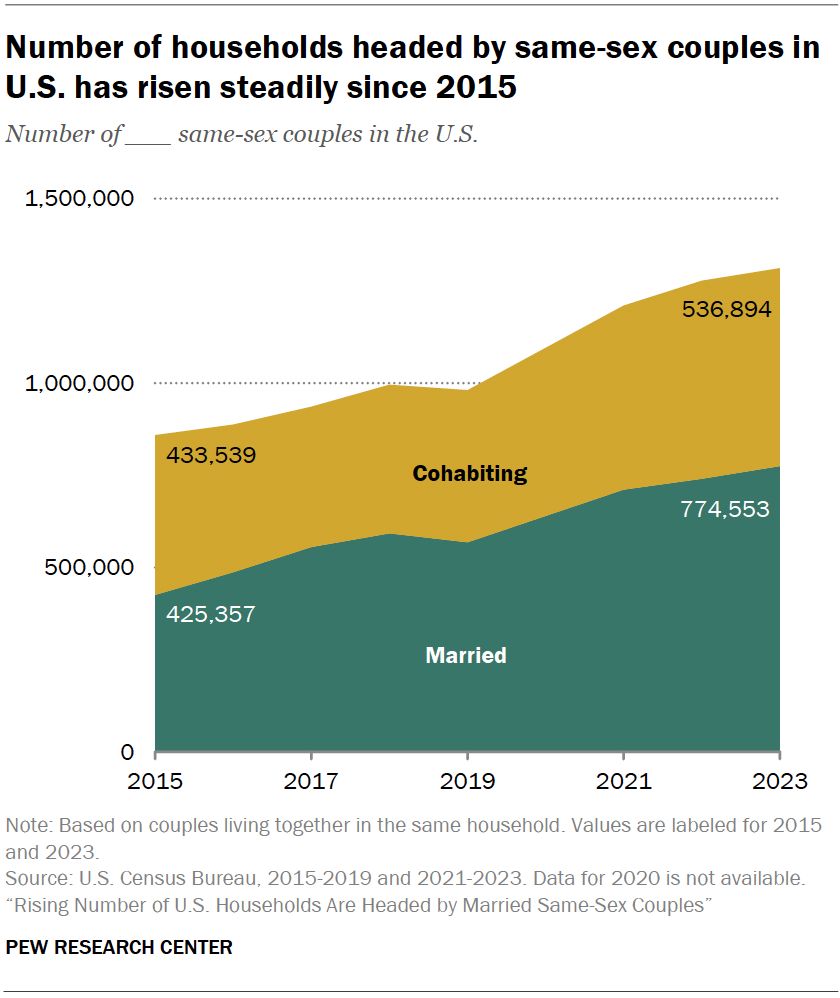
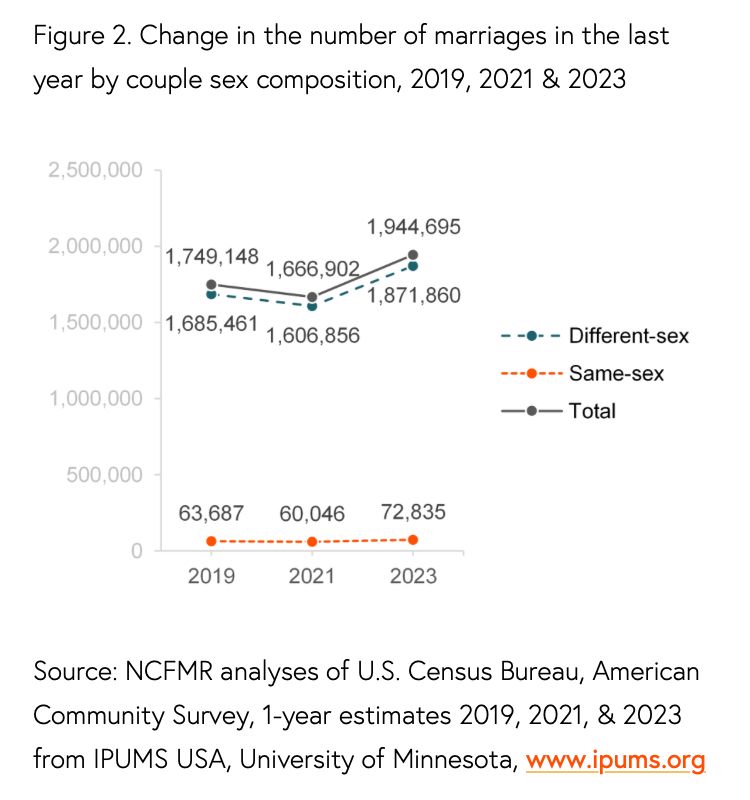
Plot showing Rising Number of U.S. Households Are Headed by Married Same-Sex Couples
A rising number of U.S. households are headed by married same-sex couples. Yet, same-sex married couples represent a very small share of all married couples – just 1.3% in 2023.
www.pewresearch.org/...
12.06.2025 21:03
👍 10
🔁 3
💬 1
📌 0

08.06.2025 22:14
👍 14
🔁 2
💬 0
📌 0