

Charitable giving by county.
03.11.2025 18:40
👍 5
🔁 0
💬 1
📌 0
Charitable giving by county.

Home prices by county.

Obesity rates by country.
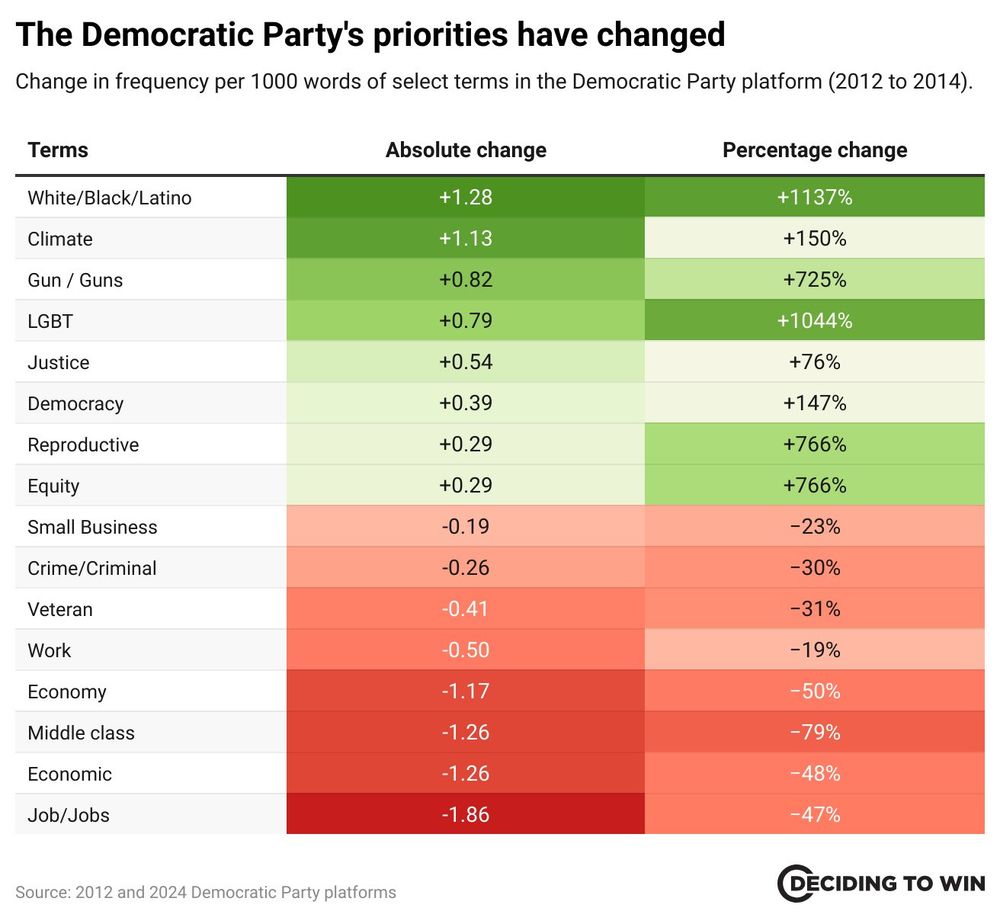
Shift in Democratic Party policies.

US voter net support for selected progressive policies.

About 1/4 of all the electrical power consumed in the state of Virginia is consumed by data centers.

Distribution of skin color of west Eurasians of last 16,000 years.

Overwhelming positive net contribution of Indian immigrants in the US.

White liberals have a more favorable view of black Christians than white Christians.
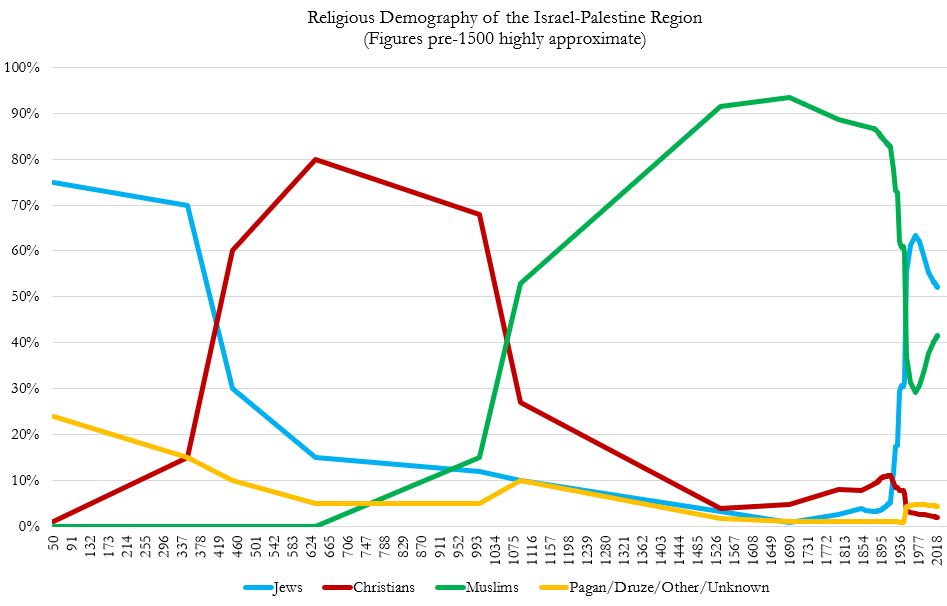
Changes in religious demography of Israel-Palestine region over the centuries.

Birthplace of US immigrants by percentage of population, 1850-2017.

Trend in opinion of socialism, by party affiliation.

Adjusted for population, Jews have earned nearly 6,000 times more Nobel Prizes in the sciences and economics than Muslims.

Concentration of economic activity in US.
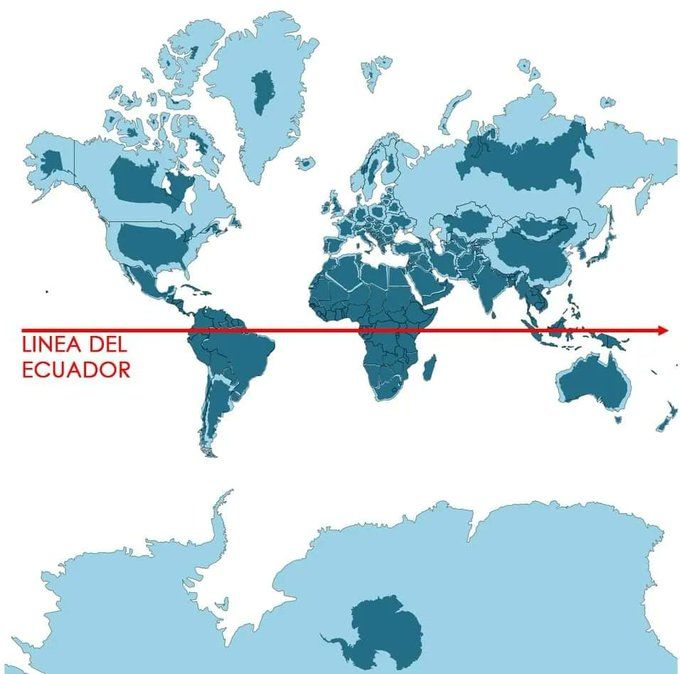
Actual size of each country.
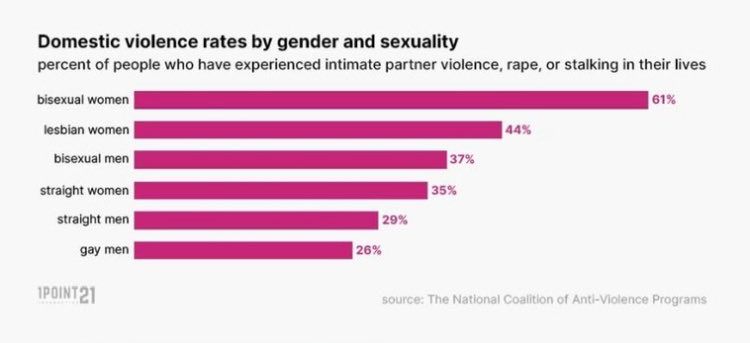
Domestic violence rates by gender and sexuality.
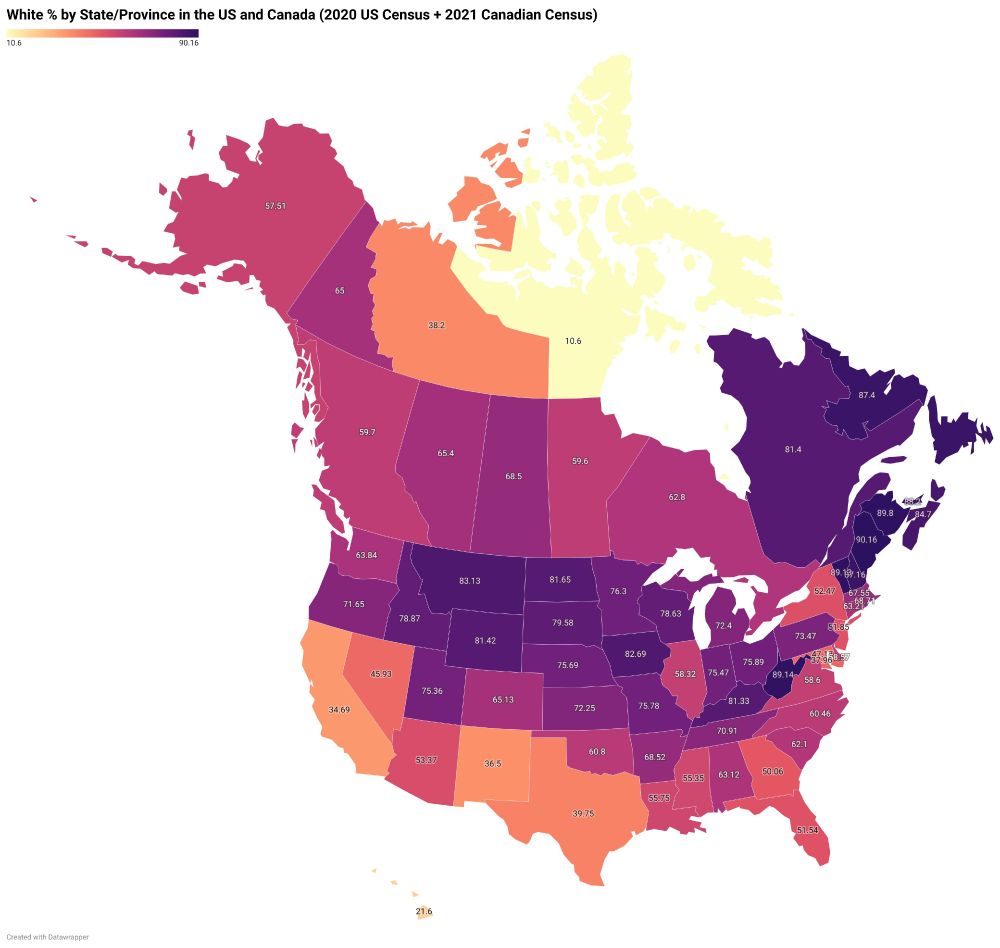
White population percentage by state and province.

Parental income distribution of ACT scores.

Terrorist attacks and plots by political orientation.
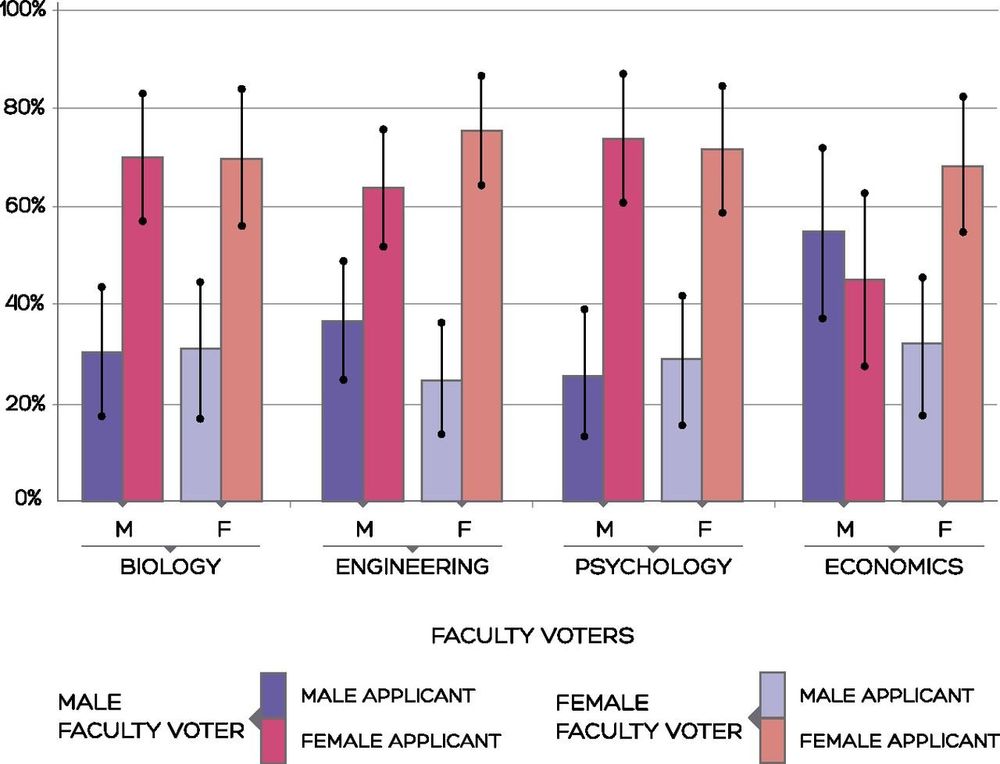
Bias against males in tenure tracking.
Yes.
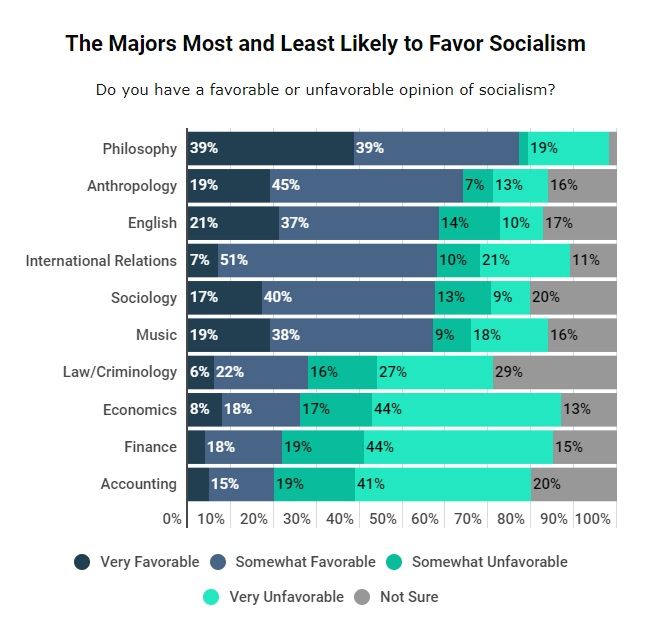
Socialism preference by college major.

Probably PISA scores.

The US counties with the lowest average IQs tend to be located in the Deep South, Southwest, and where Indian reservations are located.
The highest-IQ counties tend to be in New England, Midwest/Plains, and transplant-heavy scenic Mountain West.
I deleted the map. It seems inconsistent with the data.

Latin America is rapidly trending toward Protestantism.
US Census periodically collects these data.
I'm not aware of it being broken down by education levels and years of employment.

Foreigners in US are less criminally inclined than natives.

Support for political violence by political orientation.