Christoph Renkl's Avatar

Christoph Renkl

@christophrenkl.org

Interim Professor @unibonn.bsky.social Climate Variability and Predictability | Air-Sea Interactions | Coastal and Shelf Ocean Dynamics. www.christophrenkl.org

387
Followers
286
Following
16
Posts
25.10.2023
Joined
Posts Following

Latest posts by Christoph Renkl @christophrenkl.org

The time series above show variations of coastal MDT, alongshore current, and derived quantities on timescales >15 days. Tidal signals are averaged out (we checked that there is no aliasing).

28.01.2025 12:28 πŸ‘ 0 πŸ” 0 πŸ’¬ 0 πŸ“Œ 0

This highlights the value of using geodetic MDT estimates for model validation and ocean monitoring, making this study relevant for both the modeling and observation communities. 🌊 (5/5)

27.01.2025 19:04 πŸ‘ 0 πŸ” 0 πŸ’¬ 1 πŸ“Œ 0
Low-pass-filtered time series of the alongshore tilt of MDT at the coast of Nova Scotia and related quantities. (a) Mean alongshore depth-averaged current predicted by GoMSS (blue) and estimated from wind-corrected tilt of predicted MDT (black). (b)  predicted by GoMSS (black), diagnostic of area-integrated nearshore circulation (red), area-integrated JEBAR (blue), and flow across isobaths (green). The model output was integrated over the area enclosed by the red polygon in Fig. 1. A third-order Butterworth low-pass filter with a cutoff frequency of 15 d was applied to the time series to remove high-frequency variability and thereby allow a quasi-steady state to be assumed.

Low-pass-filtered time series of the alongshore tilt of MDT at the coast of Nova Scotia and related quantities. (a) Mean alongshore depth-averaged current predicted by GoMSS (blue) and estimated from wind-corrected tilt of predicted MDT (black). (b) predicted by GoMSS (black), diagnostic of area-integrated nearshore circulation (red), area-integrated JEBAR (blue), and flow across isobaths (green). The model output was integrated over the area enclosed by the red polygon in Fig. 1. A third-order Butterworth low-pass filter with a cutoff frequency of 15 d was applied to the time series to remove high-frequency variability and thereby allow a quasi-steady state to be assumed.

Combining theory, idealized models, and a regional ocean circulation model, we offer two complementary and dynamically consistent interpretations linking this tilt of MDT to the alongshore current and also to the area-integrated nearshore circulation. (4/5)

27.01.2025 19:04 πŸ‘ 1 πŸ” 0 πŸ’¬ 1 πŸ“Œ 0
Predicted MDT (black line) and contributions by individual terms in the alongshore, depth-averaged momentum balance at the coast on the Scotian Shelf: wind stress (Ξ·W), bottom friction (Ξ·BF), and lateral mixing (Ξ·LM) as well as their sum. The contribution from the depth-averaged baroclinic pressure gradient is also shown (gray line). Note that the mean of each term has been subtracted to center the curves around zero. Alongshore locations of the tide gauges are shown by their respective abbreviation.

Predicted MDT (black line) and contributions by individual terms in the alongshore, depth-averaged momentum balance at the coast on the Scotian Shelf: wind stress (Ξ·W), bottom friction (Ξ·BF), and lateral mixing (Ξ·LM) as well as their sum. The contribution from the depth-averaged baroclinic pressure gradient is also shown (gray line). Note that the mean of each term has been subtracted to center the curves around zero. Alongshore locations of the tide gauges are shown by their respective abbreviation.

This includes an alongshore tilt of MDT associated with the Nova Scotia Current that is balanced primarily by wind stress, bottom friction, and a small contribution from lateral mixing. (3/5)

27.01.2025 19:04 πŸ‘ 0 πŸ” 0 πŸ’¬ 1 πŸ“Œ 0
Predicted and observed mean dynamic topography (MDT). (a) MDT predicted by GoMSS (spatial median value over an area where water depth < 200 m is removed). Markers indicate the locations of the coastal tide gauges listed in Table 1. The line separates the upper Bay of Fundy where the model has difficulty resolving the residual circulation due to the limited resolution. (b) Coastal MDT as a function of distance along the coast of the Gulf of Maine and Nova Scotia. The minima in Minas Passage (βˆ’28 and βˆ’25 cm, respectively) are not shown. Geodetic estimates of MDT are shown with their respective uncertainty. The shaded area indicates the coast along the upper Bay of Fundy. Panels (c) and (d) show enlarged views of either side of the shaded area in (b). In panels (b)–(d), the means of the respective observations and predictions at the grid points closest to the tide gauges have been removed.

Predicted and observed mean dynamic topography (MDT). (a) MDT predicted by GoMSS (spatial median value over an area where water depth < 200 m is removed). Markers indicate the locations of the coastal tide gauges listed in Table 1. The line separates the upper Bay of Fundy where the model has difficulty resolving the residual circulation due to the limited resolution. (b) Coastal MDT as a function of distance along the coast of the Gulf of Maine and Nova Scotia. The minima in Minas Passage (βˆ’28 and βˆ’25 cm, respectively) are not shown. Geodetic estimates of MDT are shown with their respective uncertainty. The shaded area indicates the coast along the upper Bay of Fundy. Panels (c) and (d) show enlarged views of either side of the shaded area in (b). In panels (b)–(d), the means of the respective observations and predictions at the grid points closest to the tide gauges have been removed.

MDT (the local height of sea level above the geoid) can be estimated by coastal tide gauge observations in combination with the latest generation of geoid models. These new geodetic estimates can be used to validate MDT predictions by regional high-resolution ocean models. (2/5)

27.01.2025 19:04 πŸ‘ 0 πŸ” 0 πŸ’¬ 1 πŸ“Œ 0
Preview
The alongshore tilt of mean dynamic topography and its implications for model validation and ocean monitoring Abstract. Mean dynamic topographyΒ (MDT) plays an important role in the dynamics of shelf circulation. Coastal tide gauge observations in combination with the latest generation of geoid models are prov...

🚨New Paper!🚨

Coastal mean dynamic topography (MDT) can provide a direct estimate of the average alongshore current and also a measure of area-integrated nearshore circulation. 🌊

Our #EGUhighlights paper in Ocean Science has the details - short summary below. (1/5)

doi.org/10.5194/os-2...

27.01.2025 19:04 πŸ‘ 7 πŸ” 1 πŸ’¬ 1 πŸ“Œ 0
Preview
DalROMS-NWA12 v1.0, a coupled circulation–ice–biogeochemistry modelling system for the northwest Atlantic Ocean: development and validation Abstract. This study presents DalROMS-NWA12 v1.0, a coupled ocean circulation–sea ice–biogeochemistry modelling system for the northwest Atlantic Ocean (NWA) in which the circulation and biogeochemist...

🚨 New Paper! 🚨

We developed a coupled ocean-sea ice-biogeochemistry model of the Northwest Atlantic. 🌊

You can find all the details in our paper led by Kyoko Ohashi that got published today in Geoscientific Model Development.

doi.org/10.5194/gmd-...

10.12.2024 18:32 πŸ‘ 8 πŸ” 2 πŸ’¬ 0 πŸ“Œ 0
Intensification of Atmospheric Rivers by Marine Heatwaves: Multi-Scale Air-Sea Interaction and Downstream Effects on Coastal and Inland Climate The climate along the US West Coast is profoundly affected by air-sea interacti...

On Friday, I will present our recent research on the impact of #MarineHeatwaves on #AtmosphericRiver events. 🌊

Session A52B β€’ Room 152 A β€’ 10:20am - 11:50am
agu.confex.com/agu/agu24/me...

09.12.2024 01:16 πŸ‘ 1 πŸ” 0 πŸ’¬ 0 πŸ“Œ 0
Downscaling the Ocean Response to the Madden-Julian Oscillation in the Northwest Atlantic and Adjacent Shelf Seas Subseasonal-to-seasonal (S2S) prediction is a global effort to forecast the sta...

On Monday, swing by my poster if you want to chat about S2S #predictability and the ocean response to the #MJO. 🌊

Board 0736, Hall B-C β€’ 1:40pm - 5:30pm
agu.confex.com/agu/agu24/me...

09.12.2024 01:16 πŸ‘ 0 πŸ” 0 πŸ’¬ 1 πŸ“Œ 0

Very excited to be at #AGU24 this week! I’m looking forward to lots of science, meeting old friends, and making new connections. Let’s get in touch!

Here’s where you can find me:

09.12.2024 01:16 πŸ‘ 0 πŸ” 0 πŸ’¬ 1 πŸ“Œ 0

Gold wrote a brief BAMS note about this in 1963, in response to a request from Phillips.

He notes that he believes the earliest note was in a glossary of his 1907 paper, where there was some evident advantage in separating the Coriolis component from the centrifugal effect in gradient wind 2/🌊

26.09.2024 14:22 πŸ‘ 1 πŸ” 1 πŸ’¬ 1 πŸ“Œ 0
Post image

The model also predicts that the atmospheric circulation in response to the MJO leads to anomalous upwelling on the Scotian Shelf. (5/5)

07.05.2024 10:21 πŸ‘ 0 πŸ” 0 πŸ’¬ 0 πŸ“Œ 0
Post image

The observed relationship between the MJO and North Atlantic SST can be captured by a regional ocean circulation model demonstrating their feasibility and potential for S2S ocean prediction. (4/5)

07.05.2024 10:20 πŸ‘ 0 πŸ” 0 πŸ’¬ 1 πŸ“Œ 0
Post image

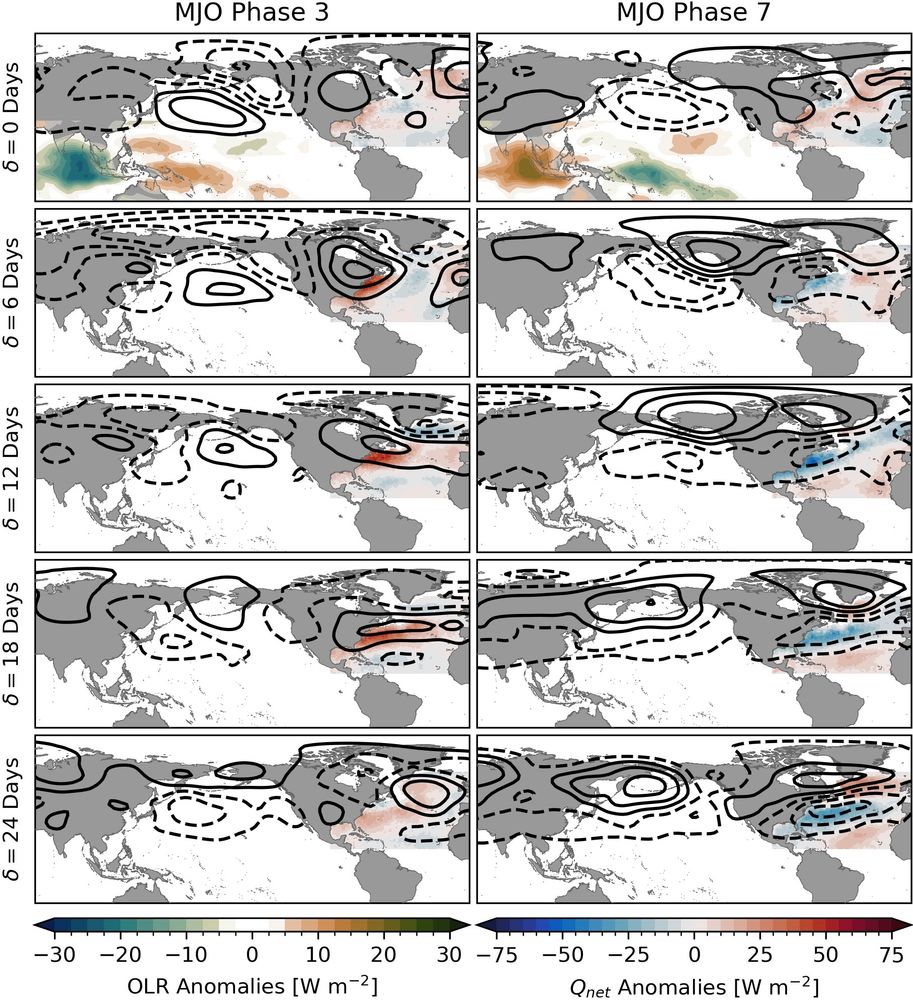
These changes are driven primarily by anomalous air-sea heat fluxes caused by large-scale atmospheric perturbations linked to the MJO. (3/5)

07.05.2024 10:20 πŸ‘ 1 πŸ” 0 πŸ’¬ 1 πŸ“Œ 0
Post image

Statistically significant large-scale #SST changes in the North #Atlantic, particularly along the eastern seaboard of North America, can be related to the MJO. (2/5)

07.05.2024 10:17 πŸ‘ 1 πŸ” 0 πŸ’¬ 1 πŸ“Œ 0
Preview
Downscaling the ocean response to the Madden–Julian Oscillation in the Northwest Atlantic and adjacent shelf seas - Climate Dynamics Subseasonal-to-seasonal (S2S) prediction is a global effort to forecast the state of the atmosphere and ocean with lead times between two weeks and a season. This study explores the feasibility of S2S...

🚨New Paper!🚨

The #MJO is a source of Atlantic Ocean #predictability on #S2S timescales. Our new paper in @SpringerNature Climate Dynamics has the details - short summary below. (1/5)

link.springer.com/10.1007/s003...

07.05.2024 10:17 πŸ‘ 4 πŸ” 0 πŸ’¬ 1 πŸ“Œ 0

Hello world!

26.10.2023 00:00 πŸ‘ 5 πŸ” 0 πŸ’¬ 0 πŸ“Œ 0