
Excited to have spent some time building this inlining detection. Will come soon with an example use case showing how to leverage this new feature 🤓
29.10.2025 14:55
👍 1
🔁 0
💬 0
📌 0
Excited to have spent some time building this inlining detection. Will come soon with an example use case showing how to leverage this new feature 🤓

It's Friday, and all your @codspeed.io runs got 2 minutes faster😎👇
codspeed.io/changelog/20...
Excited to have it out! 🎉 This is just the first step toward adaptive instrumentation: get an overview with wall-time profiling, then zoom in with CPU simulation or other instruments to reach instruction-level detail.
This also edges us nearer to real-world sampling in production 👀
If you ship Go services and care about latency and cost, this will save you time and nasty surprises in prod!
What’s inside:
- Bench patterns that actually measure your handlers, not the harness
- A tiny DummyResponseWriter to kill recorder overhead
- b.Loop() usage with Go 1.24
- Ready-to-use GitHub Action with CodSpeed and codspeed-macro runners
- PR comments + checks to block regressions before merge
🚀🦫 New guide for Gophers: Benchmarking a Gin HTTP API
codspeed.io/docs/guides/...
Want to write faster programs?
Start with the backbone of performance: the memory allocator
Last year, @apas.tel took us deep into an often overlooked topic and made it impossible to forget. Watch it again👇🏼
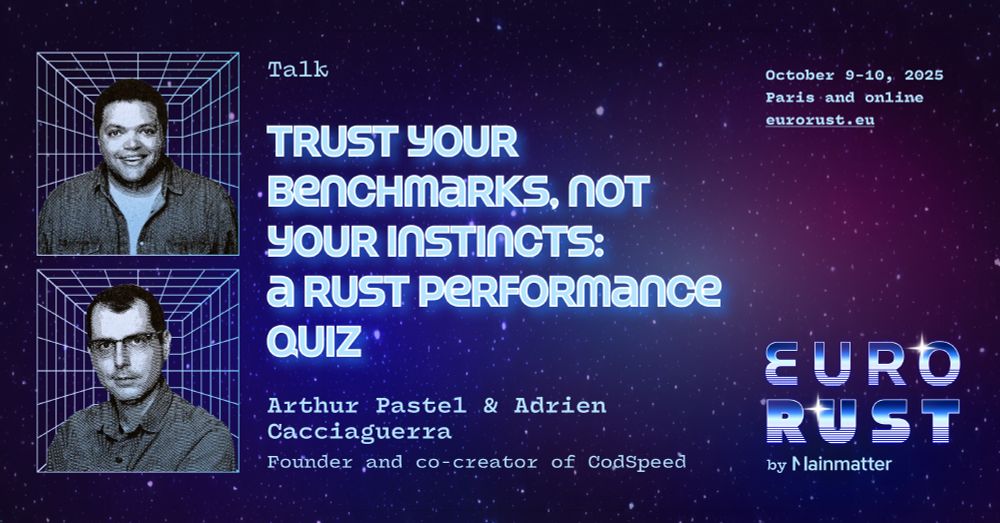
What’s faster in Rust? 🦀 Your instinct says one thing. The benchmark says something else.
@apas.tel and @adriencaccia.bsky.social are bringing a live Rust performance quiz to #EuroRust25. You don’t want to miss it!
🧵1/3
Announcing p99.chat, the assistant for software performance optimization 🚀
Describe your performance challenge, share your code, and p99 will analyze, instrument, and visualize the results, cutting the traditional setup overhead down to seconds!

We’re at @pyconit.bsky.social with @adriencaccia.bsky.social!
We’ll quizz you on Python performance again tomorrow! See you in room lasagna at 11:45!

🦀 @apas.tel - The Impact of Memory Allocators on Performance
Memory allocators are often overlooked. But Arthur makes the case that they’re a key lever for performance in Rust. Learn how they work and when to care.
🧵 5/11
📺 Watch: youtu.be/pJ-FRRB5E84

We just improved our C++ integration. Now with first-class Bazel support for larger projects!
codspeed.io/changelog/20...
We just released support for C++ benchmarks, enabling the use of our google benchmark compatibility layer to measure the performance of C++ codebases!
Learn more: codspeed.io/changelog/20...

Now, even small teams and indie devs can get reliable, high-precision performance insights without breaking the bank.
Learn more: codspeed.io/changelog/20...
Super excited about our latest changes to make performance testing more accessible! Two significant changes:
✅ The Free plan now includes private repositories (up to 5 users)
✅ Macro Runners are now globally available (bare-metal ARM64, 16 cores, 32GB RAM) with 120 min/month included for free

We now support sharded benchmark execution to provide even faster performance feedback!

But physics is catching up. As transistors shrink, heat and power constraints limit clock speed gains. But to keep Moore’s Law going, we stack more cores. GPUs push this further with thousands of parallel cores, mentioning exponential performance increase but omitting the implementation complexity.

Single-core performance gains have largely plateaued. That means no more relying on “free” hardware speed boosts. CPUs haven't stopped improving, but we must actively tap into new architectures. Concurrency, SIMD, and thoughtful optimizations can still unlock impressive speedups.
We can expect the same for most compiled languages. Though, when dealing with an interpreted language, this becomes much harder to optimize before any specialization or JIT compilation.

`x * x` generates exactly the same assembly as `x.pow(2)` in Rust and this goes even beyond powers of 2, thanks to LLVM loop unrolling and exponentiation by squaring.
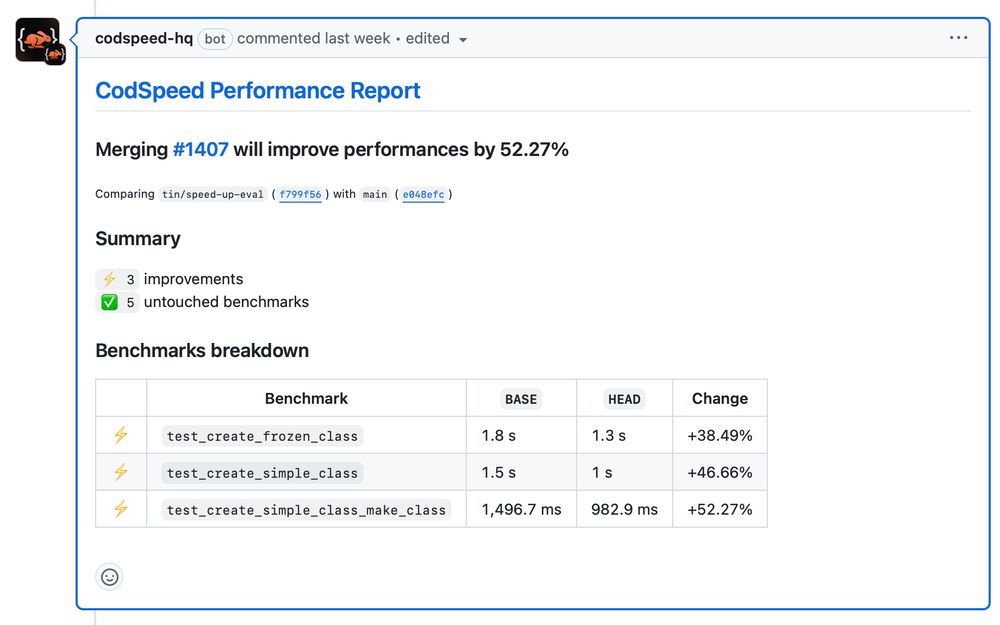
CodSpeed showing PR performance improvements between 38% for frozen class to 52% for make_class.
https://codspeed.io is pretty cool and class creation will be 38–52% faster in attrs 25.2.0
https://github.com/python-attrs/attrs/pull/1407
So for VM bytecode instrumentation, external execution path like native FFI calls need specific handling. Just like system calls need specific handing for performance measurement with native binary instrumentation.
The big issue with such an approach is that the instrumentation is limited to the interpreter itself while for native binary instrumentation the boundary is system calls and only the user space can be instrumented.
Kudos to Nikolai Vazquez for building such an intuitive benchmarking framework. We hope to contribute as much as we can to the project!

We just released a Divan 🛋️ integration. So far, this is the best developer experience you can hope for building performance tests in Rust 🦀!
codspeed.io/changelog/20...
Yes. First time but it was quite simple getting started

Started hacking on a small TUI for managing EC2 instances and SSH connections. Can’t wait to ditch AWS Console's clunkiness.


