DVS State of the Industry Survey - 2025
Let’s get talking! According to our 2024 SOTI Survey, guess how many different countries our respondents hailed from:
The 2025 survey is now open, share your unique perspective by January 15, 2026: www.surveyhero.com/c/soti2025-b...
Answer coming in the comments soon.
1. 17
2. 31
3. 58
4. 72
06.01.2026 14:41
👍 1
🔁 1
💬 1
📌 0

🎉 We’ve received 482 responses to the 2025 State of the Data Viz Industry Survey so far! Take the survey if you create #dataviz in any capacity (hobby, work, school, art), and help us spread the word: www.surveyhero.com/c/soti2025-b...
12.01.2026 14:18
👍 5
🔁 5
💬 0
📌 0

Writing Alt Text for Data Visualization
How do you write text that conveys the whole meaning of a visualization? You probably can’t. But that doesn’t mean that you shouldn’t try
Many struggle with writing alt text for charts and other other data visualizations. Amy Cesal's "Writing Alt Text for Data Visualization" hammers home the importance of explaining the chart type, the type of data, and the reason for the chart.
medium.com/nightingale/...
16.12.2025 15:03
👍 31
🔁 19
💬 0
📌 1
Hi!
17.12.2025 14:03
👍 2
🔁 0
💬 0
📌 0
Did you attend Outlier Conference in person? Photos are up (aka I have a new headshot)
Professional photos: drive.google.com/drive/folder...
09.07.2025 12:17
👍 2
🔁 0
💬 0
📌 0

A group of 11 people professionally dressed
I teach virtually at MICA, so it’s such a treat to meet up with current and former data viz graduate students in person!
13.06.2025 11:14
👍 8
🔁 0
💬 0
📌 0
Data Visualization Style Guidelines
More information on our website: www.datavizstyleguide.com
12.06.2025 15:20
👍 0
🔁 0
💬 0
📌 0
11 Review Regularly
12 It's Okay to Have a Different Font for Data Viz
13 It's Good to Show Bad Examples
14 Include Accessibility
15 Teach the Fundamentals
12.06.2025 14:05
👍 0
🔁 0
💬 1
📌 0
06 Choose the Right Format for Your Organization
7 Use Tiered Guidance to Avoid Overwhelming
08 Limit Your Colors & Include the Whole Rainbow
09 Be Clear & Concise
10 Onboarding Matters
12.06.2025 14:04
👍 0
🔁 0
💬 1
📌 0
01 Co-create With Designers, Developers, & Doubters
02 Engage With Your Stakeholders
03 Iterate Like Crazy
04 Know What You're Working With
05 Be Practical
12.06.2025 14:03
👍 0
🔁 0
💬 1
📌 0

2 people standing on stage in front of a screen
At #Outlier2025 talking about style guide tips with @alangwilson.bsky.social @datagrazing.bsky.social & @policyviz.bsky.social
12.06.2025 13:53
👍 12
🔁 1
💬 1
📌 1
7 was @datagrazing.bsky.social and I was 8.
You can catch the talk for the next 2 weeks with a virtual ticket for Outlier conference or wait a few months until the videos are on YouTube.
It’s too much to explain in a message!
12.06.2025 13:50
👍 1
🔁 0
💬 1
📌 0
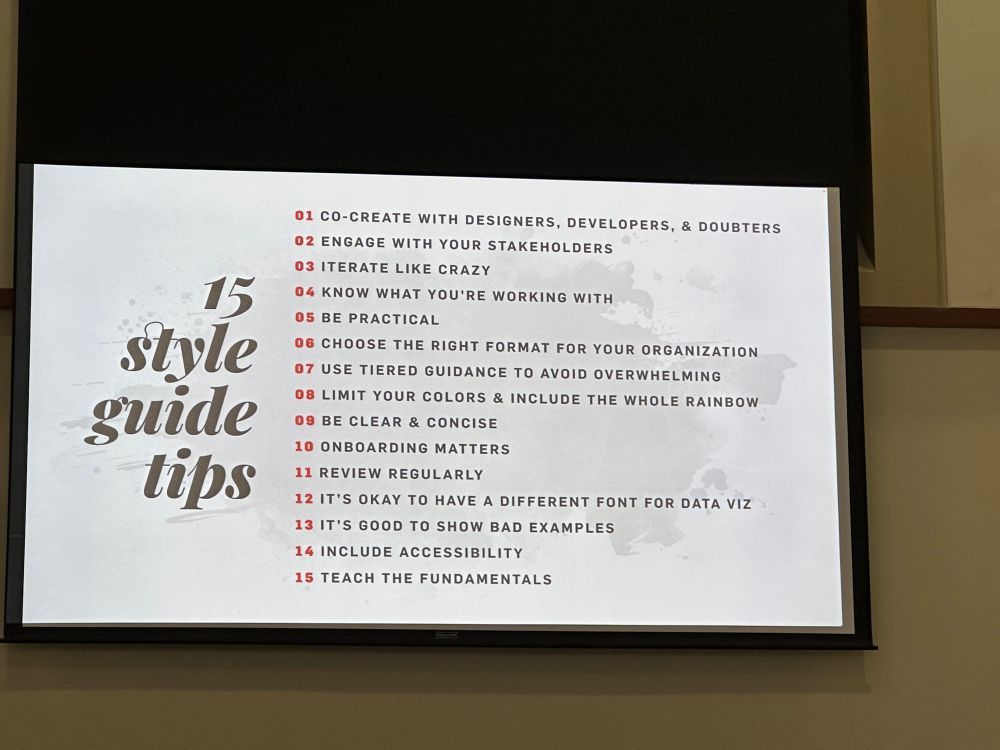
Thankfully @amycesal.com, Max Graze, Alan Wilson and @policyviz.bsky.social managed to get their fifteen style guide tips into one summary slide at #outlier2025 so I didn’t have to pick one!
11.06.2025 18:01
👍 21
🔁 5
💬 1
📌 0

Photo of me, a white woman with short brown hair, in front of the data viz society step and repeat
Excited to speak soon at #Outlier2025
11.06.2025 17:15
👍 16
🔁 1
💬 0
📌 0

View of the ocean with boats on the water
Morning views #Outlier2025
11.06.2025 11:17
👍 7
🔁 0
💬 0
📌 0

Registration — Outlier
If you're interested in Data Visualization, get your ticket for the data viz conference Outlier. If you're a Data Visualization Society member, virtual tickets are only $150!
www.outlierconf.com/outlier-2025...
03.06.2025 16:03
👍 2
🔁 3
💬 0
📌 0
I am unapologetically telling you right now that Chicago is going to be insufferable about this, there is still a fading cardboard John Paul II in a Michigan Ave storefront looking out at Grant Park because he spoke there *once.*
08.05.2025 18:10
👍 5619
🔁 548
💬 173
📌 91

Tips for charts for Social Media - everviz
Creating charts for social media requires you to think about the medium. The same exact chart that you created for a report rarely works well just uploaded to Instagram. You need to grab people’s atte...
How do you make charts for social media?
@everviz.bsky.social is the (only?) tool that creates gifs of animated charts. I wrote a blog post about animation and other considerations (like audience, thanks @allitorban.bsky.social ) for creating charts for social media
www.everviz.com/blog/tips-fo...
07.05.2025 16:32
👍 5
🔁 1
💬 1
📌 0
Special Awards nominations open for the 2024 IIB Awards. Submit your nominations for the Test of Time and Impactful Community Leader awards by April 11.
www.datavisualizationsociety.org/iib-awards-s...
31.03.2025 19:26
👍 2
🔁 1
💬 0
📌 0
Whoh! Cool!
21.03.2025 20:13
👍 2
🔁 0
💬 0
📌 0

Call for Outlier Speakers - apply by march 15
Speaker applications are still open for Outlier 2025, the annual conference that brings the community together to evolve the possibilities of data viz.
docs.google.com/forms/d/e/1F...
10.03.2025 17:35
👍 3
🔁 1
💬 0
📌 0

Past the Pie Chart - everviz
If you would like to switch up your chart visualizations, here are a few alternatives to the pie chart and what they work well for.
🥧 Love pie but had too much? Variety is the spice of life—and data viz!
Pie charts are great, but line and bar charts can serve up the same data in fresh ways. 🍰
Check out @amycesal.com's latest everviz blog post for tasty alternatives: www.everviz.com/blog/past-th...
What’s your favorite pie? 🥧
25.02.2025 11:19
👍 0
🔁 3
💬 0
📌 0

I'm a judge for the information is beautiful awards
I'm excited to be a judge for the Information is Beautiful Awards again this year! Longlist announcement coming March 10th
19.02.2025 23:37
👍 4
🔁 0
💬 0
📌 0

scatterplot of dots over time with total downloads on the y axis
A sign that accessibility and data viz is important: the most downloaded episode of the Data Stories Podcast ( @moritzstefaner.bsky.social @ebertini.bsky.social ) is the episode about accessibility with the amazing @fossheim.bsky.social
Check out the data: observablehq.com/@moritzstefa...
13.02.2025 18:30
👍 10
🔁 4
💬 0
📌 2

Information+ Conference 2025
#info+ 2025 conference announced!! informationplusconference.com/2025/
29.01.2025 18:21
👍 19
🔁 12
💬 0
📌 2

Call for viz: January 31, 2025
Information is Beautiful Awards deadline approaching: January 31
Just a few more days to enter the awards: www.informationisbeautifulawards.com/awards/2024
29.01.2025 15:48
👍 2
🔁 0
💬 0
📌 0

Brown haired woman sitting at a desk with a blue background
Today is our @datavizsociety.bsky.social Annual General Meeting - my last as the Executive Director.
I'm so excited for what DVS will continue to do in the years to come, as we need #dataviz now more than ever to make sense of the world.
Join us at 2pm EST: www.youtube.com/live/WJfMbU2...
21.01.2025 18:44
👍 25
🔁 4
💬 4
📌 0


