Our final updates have been posted to the Climate.gov website, and this will be our final post to our social media channels.
27.06.2025 21:00
👍 955
🔁 418
💬 118
📌 162
Our final updates have been posted to the Climate.gov website, and this will be our final post to our social media channels.

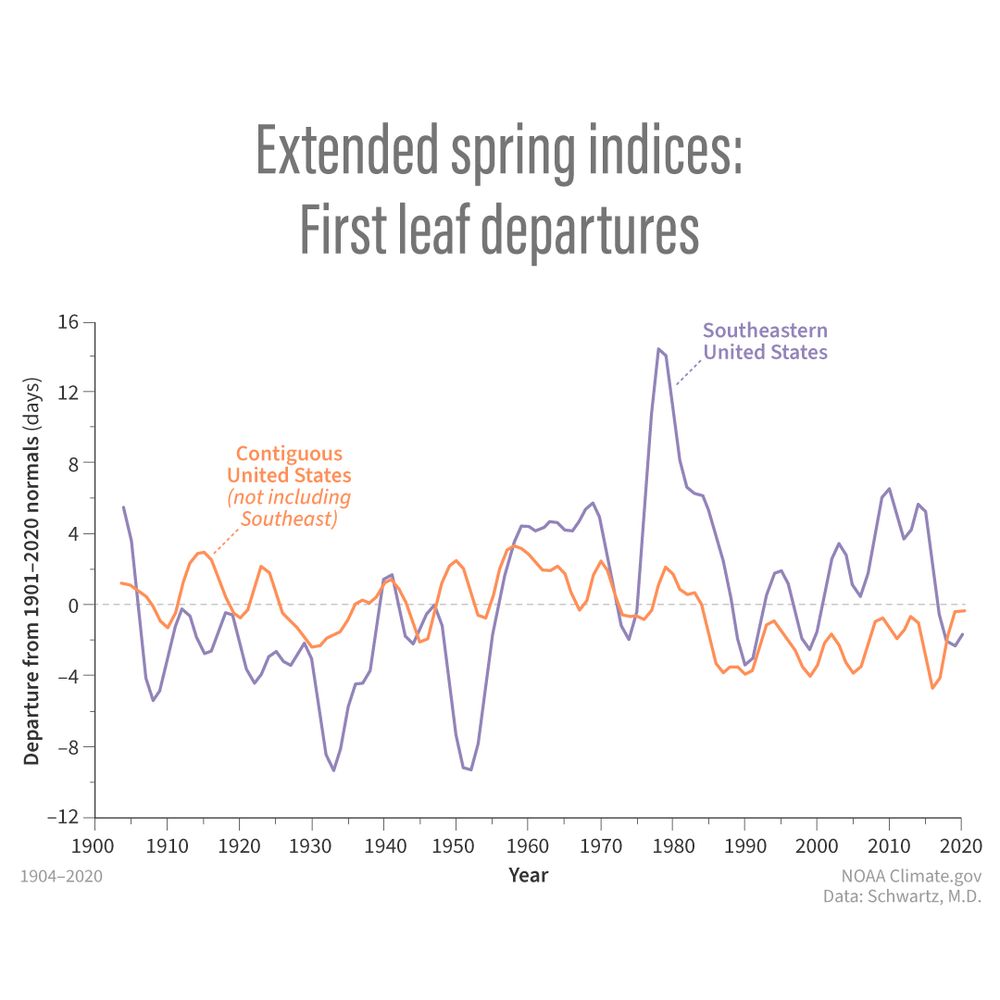
Long-term trends in first leaf and first bloom dates across the U.S. are responding to long-term changes in temperatures. However, the trend across the Southeast may be surprising to some.
Find out why: climate.gov/news-feature...


Extreme heat is worsening around the world and the stakes for heat safety are higher now than ever. Heat-related incidents at outdoor events are forcing the private and public sectors to confront the growing challenge of heat governance.
Learn more: climate.gov/news-feature...
June 21 is Show Your Stripes Day—a time to spark conversation about how our world is warming.
This video shows how @noaa.gov temperature data for the U.S. is turned into the iconic stripes visualizations you may see shared today and tomorrow.
@edhawkins.org


Forecasting rain is more important than ever, but skill hasn't improved since the 1990s. @NOAA 's Climate Program Office is working with partners to boost accuracy and help communities prepare for extreme weather.
Learn more: www.climate.gov/news-feature...
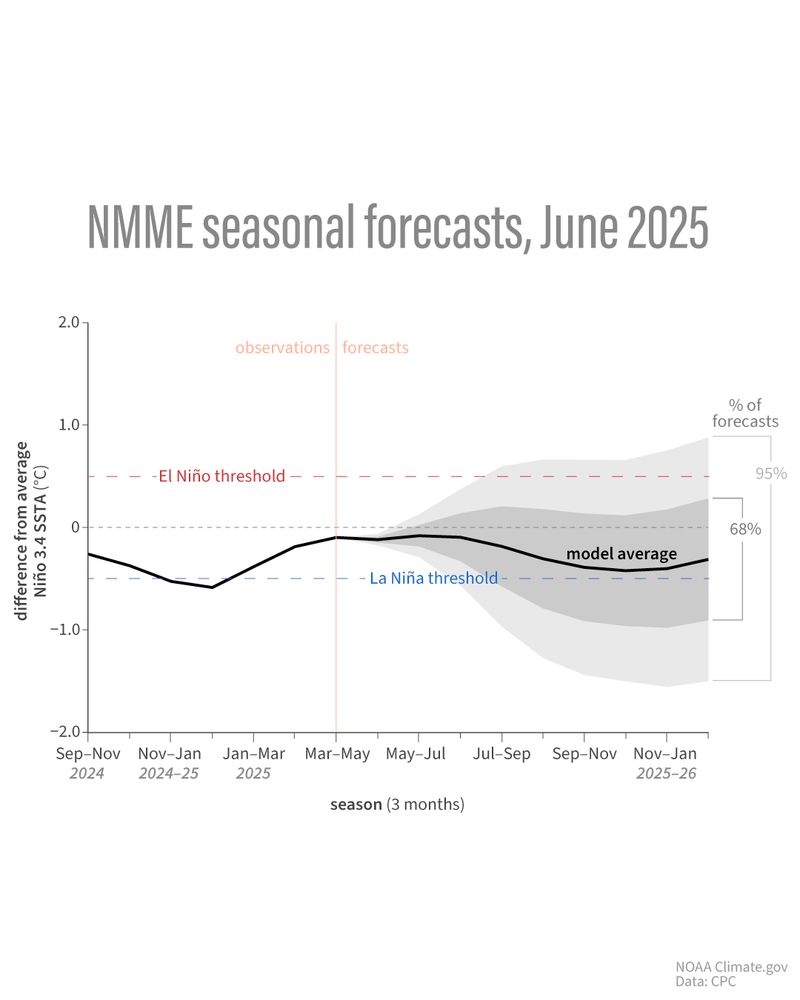
Line graph showing observed and predicted temperatures in the key ENSO-monitoring region of the tropical Pacific from spring 2025 through the fall. By late summer, the shading spans from El Niño to La Niña, showing the range of potential ENSO states. However, the majority of model forecasts are concentrated in the neutral range, meaning the highest chance is that the temperature in the Niño-3.4 region of the tropical Pacific will be near average.
ENSO-neutral conditions are expected to continue through summer.
While the odds of La Niña increase through the fall, the odds of neutral conditions continuing slightly outweigh those of La Niña.
Find out what ENSO-neutral means for seasonal prediction? www.climate.gov/news-feature...
🍃These maps compare this year's leaf-out dates to the first bloom dates. Several areas were in sync. What was extremely rare was the combination of early leaves but late blooms. 💮
Can you find a good example? Let us know in the comments!
Read more: www.climate.gov/news-feature...

Temperature and Precipitation outlook for June 2025 for the US

Drought outlook for June 2025 and drought conditions at the end of May across the US
As we head into summer and typical hot weather, what is the June outlook?
Here’s what @NWSCPC expects this month:
www.climate.gov/news-feature...
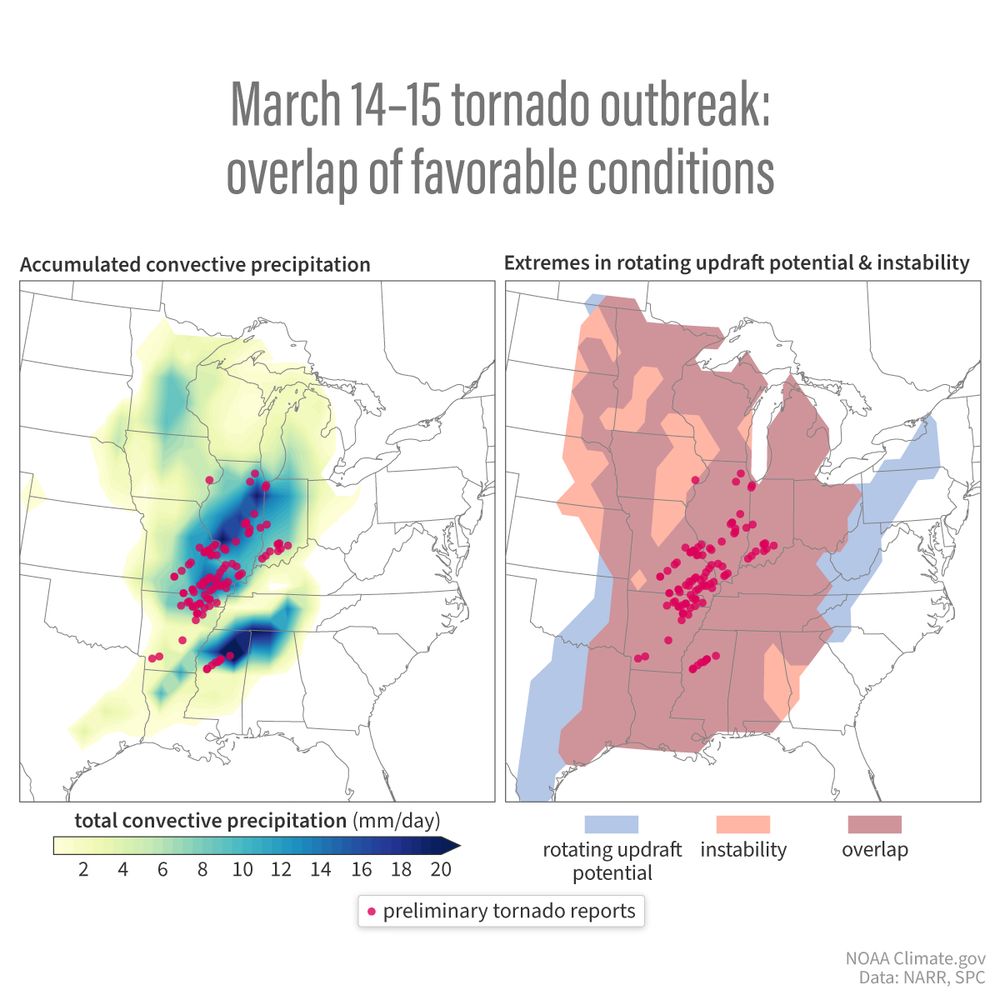
Map pair titled "March 14-15 tornado outbreak: overlap of favorable conditions." First map shows accumulated convective precipitation, and the second map shows extremes in rotating updraft potential and instability. Both maps show tornado locations with red dots.
Tornado activity to date has been above average. How does La Niña make tornado-friendly weather more likely? Our guest blogger explains: www.climate.gov/news-feature...
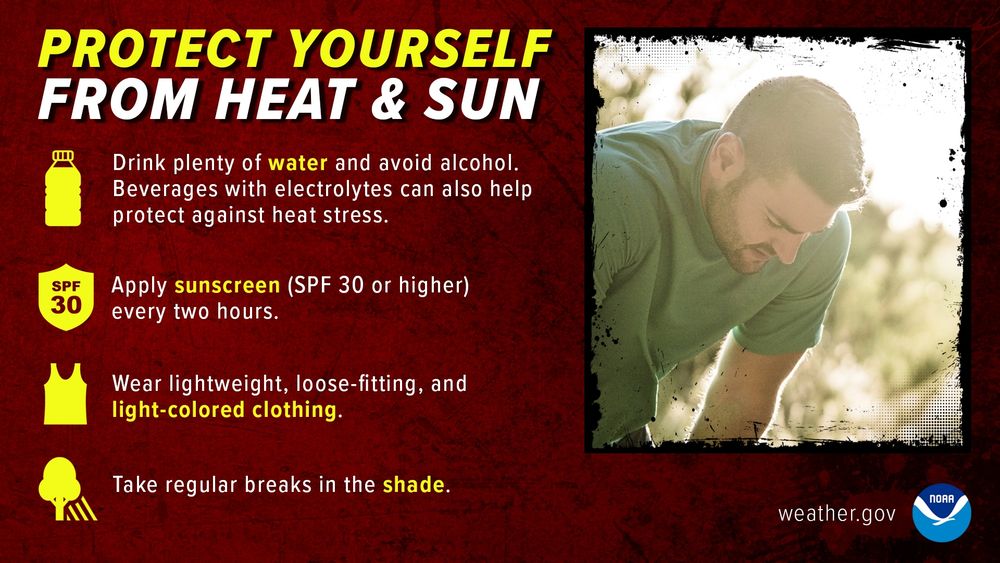
A person resting on a hot day. The text says, “Protect yourself from heat and sun. Drink plenty of water and avoid alcohol. Beverages with electrolytes can also help protect against heat stress. Apply sunscreen (SPF 30 or higher) every two hours. Wear lightweight, loose-fitting, and light-colored clothing. Take regular breaks in the shade.”
Sunburns not only increase your risk of skin cancer but also increase your risk of heat-related illness and dehydration. On #DontFryDay, learn how to protect your skin by finding shade and wearing protective clothing.
Learn more: bit.ly/3Vhzzcc
#HeatSafety #NIHHIS

An adult hiking with their dog and wearing a hat and long-sleeved shirt to protect them from the sun. The text says, "Don't Fry Day. The Friday before Memorial Day. skincancerprevention.org. National Council on Skin Cancer Prevention. Sun Safety Checklist: sunscreen, sunglasses, hat, protective clothing, and shade."
Stay safe from the #heat and sun this summer! Follow these tips:
Stay hydrated.
Apply sunscreen.
Wear lightweight, loose-fitting, and light-colored clothing.
Take breaks in the shade.
Learn more: bit.ly/3Vhzzcc
#HeatSafety #DontFryDay #NIHHIS

A group of children sitting on a sports field. In the foreground of the photo, there is a young person drinking from a bottle of water. Image Credit: Pexels
Heading to a summer camp? Keep kids safe from #heat while they spend time outdoors:
● Give them plenty of water.
● Dress them in loose, light-colored clothes.
● Teach them the signs of heat illness.
More: bit.ly/4gzNgvw
#HeatSafety #NIHHIS

A hiker standing at the top of a mountain. A quote from Sabrina of Lake Tahoe, CA, 1991 says, "I decided to hike Mt. Tallac, 10 miles, often running. I chose to hike alone, without water, and I did not check the weather. When I returned I was clammy, shaking, ash gray, and had a splitting headache and felt nauseous. It took over a day to recover. Don't be lazy. Always have plenty of water."
Traveling this summer? Make sure you know heat risk where you're traveling and how to stay safe during travel activities, such as hiking and going to the beach. Stay hydrated, and check on your travel partners.
More #HeatSafety tips: heat.gov
#NIHHIS

An adult checking on a child in the backseat of a car. The text says, “Don’t forget anyone in a hot car. Everyone operates on auto-pilot once in a while. Have a plan! Place a bag or other item in the backseat to remind you of passengers after you park. Place a stuffed animal in the front seat as a reminder to check for passengers. Consider additional methods, such as phone alarms, partner/buddy check-ins, or built-in car reminder systems.”
One in four hot car deaths happens when a child gets trapped in a locked vehicle and experiences heat stroke. Even on a cool day, a car’s temperature can become deadly in minutes. Lock your vehicle doors, and keep keys out of reach.🔒 bit.ly/3UGH1gI
#HeatSafety #NIHHIS

Follow these tips to stay hydrated and safe from #heat:
• Drink more water, regardless of how active you are.
• Don’t wait until you’re thirsty to drink.
• Stay away from very sugary or alcoholic drinks.
More information: heat.gov
#HeatSafety #NIHHIS

Do you have a #HeatSafety plan? Check in with your friends and family to make sure they know what to do during extreme heat. Take breaks and use a buddy system if spending time outdoors in the heat.
More: bit.ly/3JurQRb
#HeatSafety #NIHHIS

Check on friends, family, teammates, & colleagues to make sure they’re staying safe from heat. Make sure they
💧 Drink plenty of water.
🏠 Have access to air conditioning or a cooling shelter.
🌡️ Know the signs of heat-related illness.
More: bit.ly/3JurQRb
#HeatSafety

Heat-related illnesses are preventable with proper planning, education, and action. Learn how to recognize and treat heat stroke and heat exhaustion, so you can stay safe as temperatures rise.
Visit Heat.gov for more #HeatSafety information from #NIHHIS.

Ever wonder what's actually in wildfire smoke? Beyond the flames, it brings toxic haze and dangerous air. We break down what’s in the smoke and how it affects our health. Read more: www.climate.gov/news-feature...

Next week, the National Integrated Heat Health Information System (#NIHHIS) is hosting a Heat Safety Week to provide information about #heat risks and ways to stay safe this summer.
Follow along with #HeatSafety. Visit Heat.gov for more information about heat.
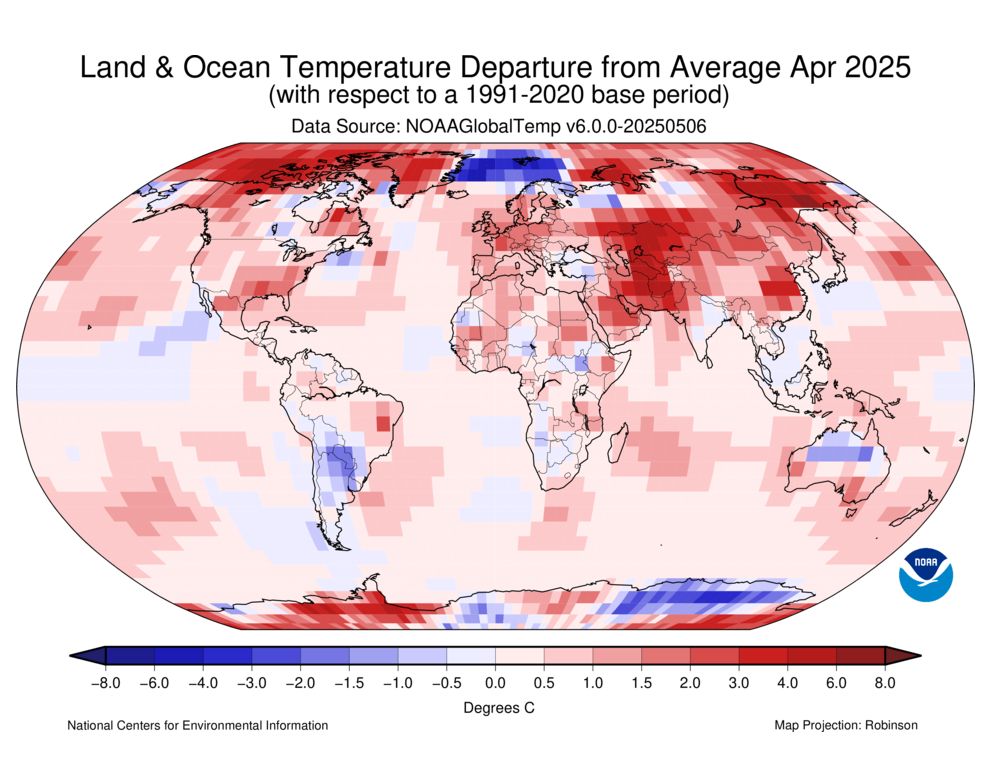
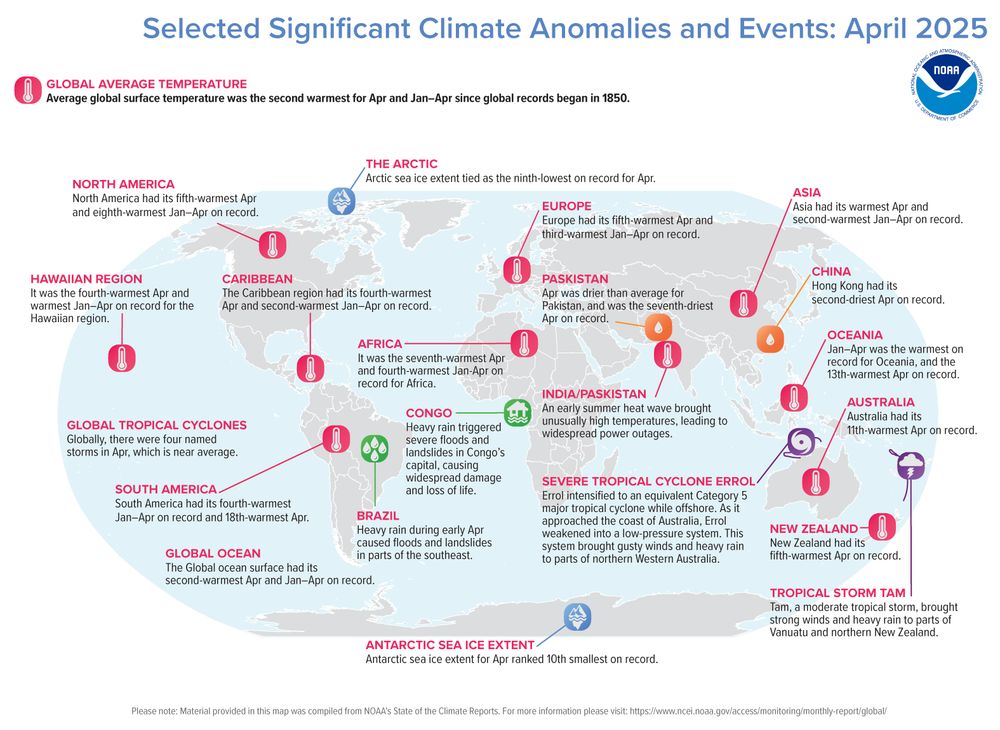
Just in: #April 2025 was 2nd warmest on record for the globe
Access our report highlights with captioned map images at: bit.ly/Global202504
via NOAA's National Centers for Environmental Information (NCEI)


Atmospheric signs of this past winter’s La Niña continue to weaken. As the tropics settle into ENSO-neutral territory, other patterns have a chance of influencing seasonal climate. Will La Niña re-emerge? Our blogger breaks down the odds. Read more: www.climate.gov/news-feature...

NOAA’s climate outlook for May leans toward well above average temperatures across much of the North and East, dryness around the Great Lakes, and soggier-than-average conditions in the Southern Plains. Read more: www.climate.gov/news-feature...

Two graphs with the title "Mean daily surface temperature during 2024." One graph shows temperature from January 2024 through January 2025 near the Galapagos, while the second graph shows the same data near Washington D.C. The graphs show the average climatology in a black line, with variations above in red and below in blue.
Climate is the average of weather, but that’s not the whole story. Otherwise, how would we explain the differences in these two graphs? Our ENSO blog explains:
www.climate.gov/news-feature...
Sorry about that! The original link should be working now.
For #tbt, have a look back at our interactive map showing the latest spring snow on record for thousands of US locations. This video previews how to use the map to check the latest spring snow date based on data through 2018. Explore: www.climate.gov/spring-snow
A doodled graphic of the Earth with the text “Every day is Earth Day” on it. The Earth is surrounded by drawings of nature including a desert, tropics, tundra, marine and deep sea environments, mountains, forests, rivers, and hills. Credit: Kaleigh Ballantine/NOAA.
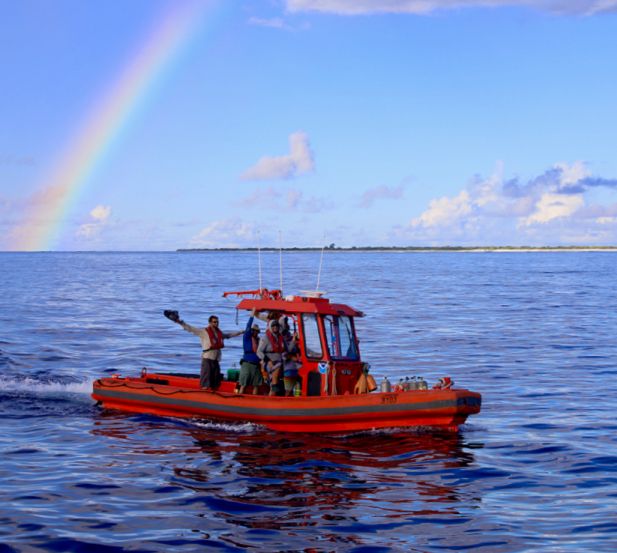
A NOAA small boat returns to ship under a rainbow after collecting water samples and deploying scientific instruments in the Pacific’s Kure Atoll. Credit: James Morioka/NOAA.
Today is the big day! Happy #EarthDay from NOAA!
Check out noaa.gov/Earthday, & visit noaa.gov any time for the latest Earth science news, scientific research discoveries & ways you can get involved to help our home planet.

Pictured: Bullfrog on a lily pad. Credit: iStock.
It’s our 4th & final week of #EarthMonthNOAA!
-Visit noaa.gov/earthday throughout the week great content, like:
-Deepwater Horizon: 15 years of research, recovery and restoration.
-How sharks keep the ocean healthy.
And more!
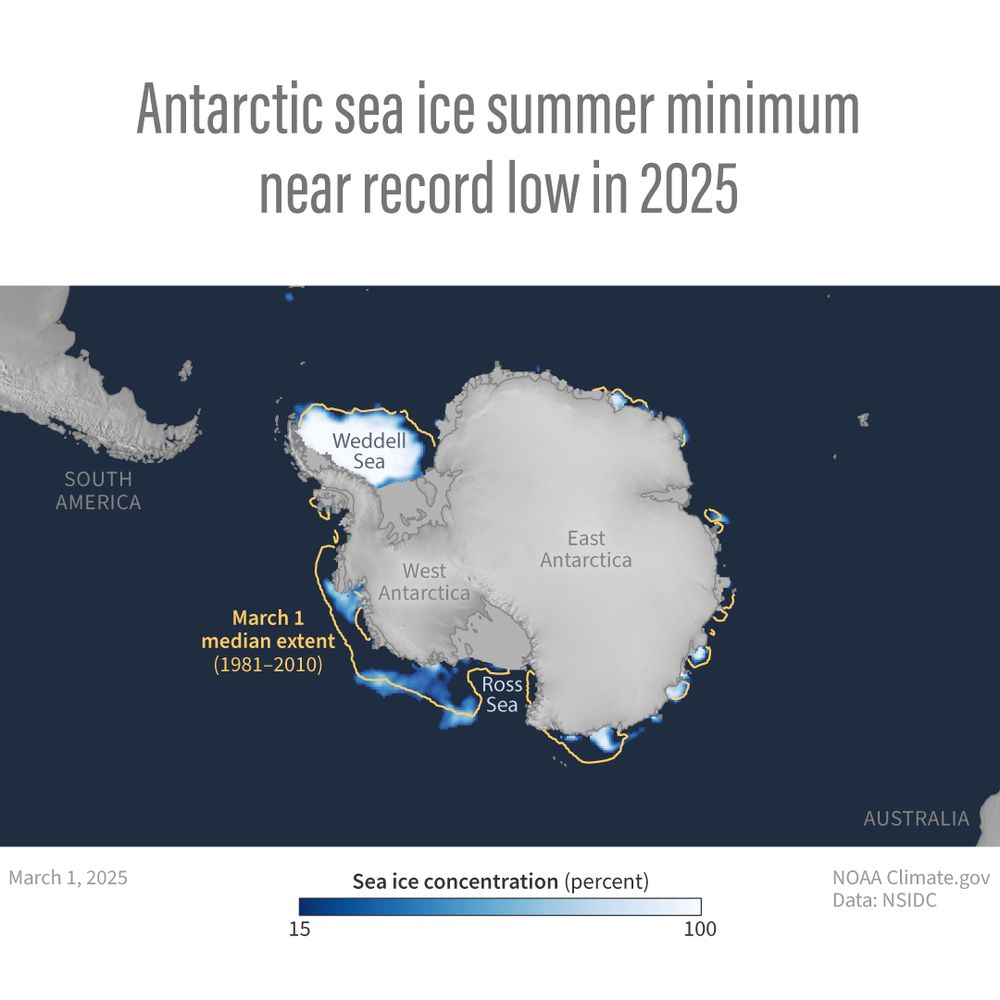
On March 1, Antarctic sea ice reached its smallest coverage of the year. This year’s minimum extent tied 2022 and 2024 for the second-lowest summer sea ice area observed since satellite records began in 1979. Learn more: www.climate.gov/news-feature...
When is it safe to start planting outdoors? This video shows how to use our NOAA map to find the average date for the last freezing temperatures of the season at your location, based on U.S. climate normals data from 1991-2020. Read more: www.climate.gov/spring-freeze


