Interests in ML and social aspects of tech.
Building For You feed: https://bsky.app/profile/spacecowboy17.bsky.social/feed/for-you
Hobby project: linklonk.com
Assistant Professor of Biology at Western Illinois University; Research and teaching on aquatic animals; fish-lover; #Rstats; Dad x2
Musical. Friend. Swattie.
📊 data visualization engineer, 💊 healthcare analytics consultant, 🐶 dog mom, 🌱 vegan for the animals.
https://nicolemark.heygrid.co/
We're on a mission to elevate how business communicates and understands data, tackling complex problems with innovative solutions. JasonForrestAgency.com
Global Services Manager @ Hyland | Passionate about services, healthcare, digital health, AI & cloud | BSc, PRINCE2, MSP, L6σ Green Belt | Opinions are my own | https://linktr.ee/paulcochrane
Designer / Developer
👥 https://consult.now - client conversion platform
🔗 https://links.supply - Bsky link aggregator
🗓️ https://siliconmingle.com - UK tech community
📦 https://product.now - software directory
travis.st/reet
Data Nerd, Tableau Public Ambassador, speedcuber, aspiring unicyclist
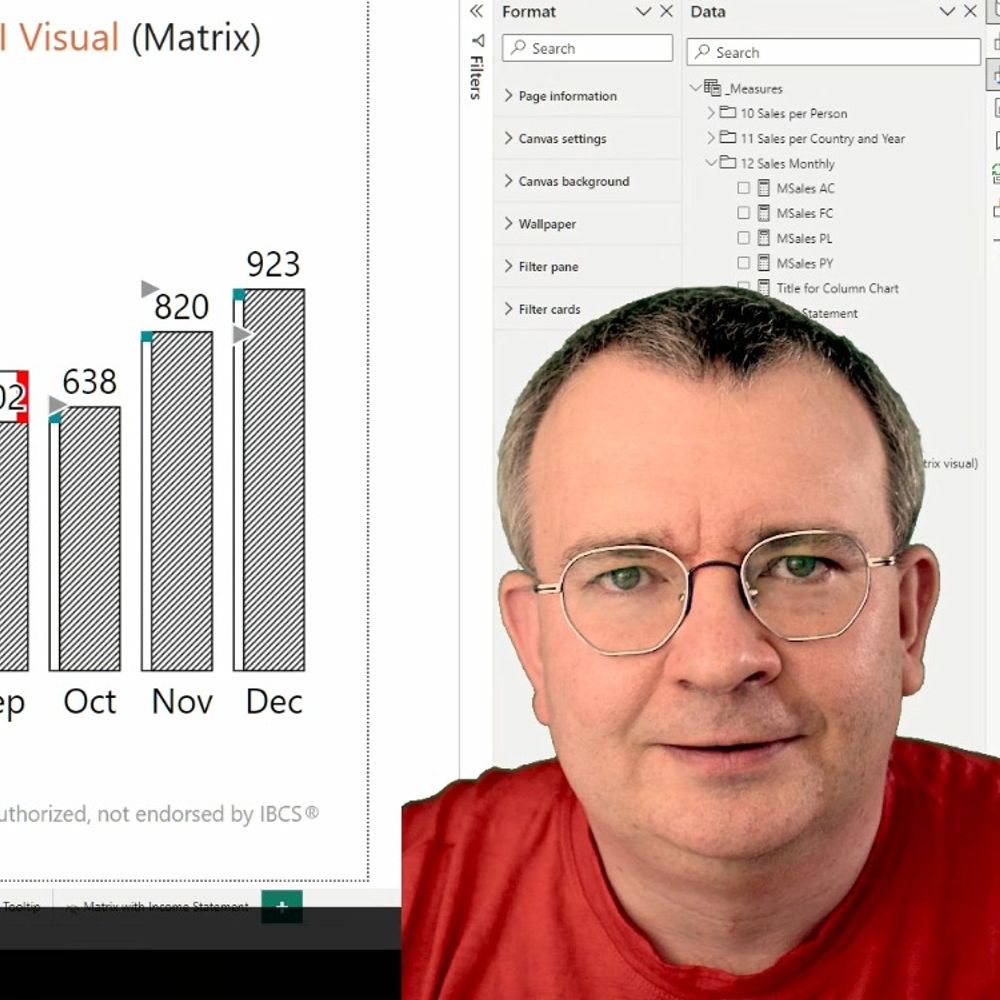
Power BI Developer and Consultant
Data Explorer, Visualizer, Explainer
IBCS® Certified Analyst
Home of Truth
Free newsletter subscription: BorowitzReport.com
Rehabilitated network security professional; unrehabilitated English major and bookworm (fiction, biography); childless cat/dog lady; NPR nerd; follower of current events, culture, and comedy (esp when they overlap, as they often do).
Raleigh. How might we visualize people, fairly and equitably? Data / dataviz / design / psychology / research geek. He / him. Chaotic good. Follows Fizzlethorpe Bristlebane. Design / research / writing at https://3iap.com.
creative coder, basketball data nerd, preferrer of democracy
also into coffee shops, sad folk music, basketball, and playing chess poorly
data viz: http://perthirtysix.com
creative coding: http://shrikhalpada.dev/projects
Food.Action.Music.Books. Happy on the end of a rope.
Programme BBC radio shows -write books, make music and get out and about.
Welsh Indian South African Dutch Londoner. PhD in Philosophy of Education. Antiracist Dialogic Pedagogy. Children's Books. Teaching & Writing.
Rep: Rachel Mann, CAA https://www.darrenchetty.com/
writer ∞ lusus naturae ∞ adult orcish female ∞ acct managed by @hypv.bsky.social ∞ it/she
design enthusiast | tableau visionary | iron viz finalist '23 | ✈️🐠🥁📊
Internet Shenanigans: https://linktr.ee/brrosenau
Forms and survey specialist.
Always keen to try to answer your questions about making better forms (and if you must, maybe even those about surveys).
Effortmark.co.uk
An arboreal, poly, gender non-participant mapmaker.
• Portfolio & tutorials: somethingaboutmaps.com.
• Prints: https://somethingaboutmaps.com/Storefront
• You can support my art & teaching at http://patreon.com/pinakographos.
Professor of Visual Analytics who does datavis, visualization storytelling and natural travel. Did I mention visualization?
Journalist at @financialtimes.com Formerly @thetimes.com and The Sunday Times | Editor, writer and occasional coder | Markets and tech | Views my own
🌐 http://raydouglas.co.uk
Co-founder & editor, Works in Progress. Writer, Scientific Discovery. Podcaster, Hard Drugs. Advisor, Coefficient Giving. // Previously at Our World in Data.
Newsletter: https://scientificdiscovery.dev
Podcast: https://harddrugs.worksinprogress.co
🏳️🌈
Professor, UW Biology / Santa Fe Institute
I study how information flows in biology, science, and society.
Book: *Calling Bullshit*, http://tinyurl.com/fdcuvd7b
LLM course: https://thebullshitmachines.com
Corvids: https://tinyurl.com/mr2n5ymk
he/him
ASA Fellow; #rstats developer of graphical methods for categorical and multivariate data; #datavis history of data visualization; #historicaldatavis; Milestones project
Web: www.datavis.ca
GitHub: github.com/friendly
Solution Engineer for Tableau | Drummer | Biker | Disc Golfer | Blogger | Husband/Dad | U Akron Alumni | Ohio State Grad Student | Podcast Host - "Songs That Don’t Suck"
Writing about robots https://itcanthink.substack.com/
RoboPapers podcast https://robopapers.substack.com/
All opinions my own
Creator of 📰 News feeds, @xblock.aendra.dev, @moji.blue, founder of @shoots.green, co-organiser @atproto.london.
Opinions my own. Not a journalist or an engineer, but a secret third thing (panicked).
she/her/ze/hir 🏳️⚧️
🌐 aendra.com
🗞️ ft.com/æ
Dataviz | Information Design
The person behind The Dataviz Bookshelf, The Data Design Manifesto & The Design Matters newsletter series.
I don't use autocorrect. I own all of my typos.
https://www.datarocks.co.nz
NLP PhD @ USC
Previously at AI2, Harvard
mattf1n.github.io
cartographer of things
https://andywoodruff.com/
Tableau Visionary: https://shorturl.at/zovrY
Youtube: https://www.youtube.com/@TableauTim
Consultant: https://www.aimpointdigital.com/
Other links: bio.site/timngwena
Also ngwena.bsky.social for everything else
Jessica Fletcher/She-Ra mashup wielding a laptop and an insane amount of curiosity Event Driven Everything, Kafka Duchess 👑 #BillsMafia She/her
Visual journalist and engineer at Axios. Builder of websites, data visualizations, and pixel cats. She/her.
data scientist in toronto / maps and dataviz / almost useless trivia knowledge
https://ivabrunec.github.io/
Create and share social media content anywhere, consistently.
Built with 💙 by a global, remote team.
⬇️ Learn more about Buffer & Bluesky
https://buffer.com/bluesky
▵ Making your data visualization workflow easier: ladataviz.com
▵ Uncharted Area, a newsletter about building a two-people company in data visualization: newsletter.ladataviz.com
▵ Figma to Tableau Plugin: http://bit.ly/Figma2Tableau
I like talking about data visualisation and actionable insights in Power BI, and pushing for better vis & UI/UX.
Columnist and chief data reporter the Financial Times | Stories, stats & scatterplots | john.burn-murdoch@ft.com
📝 ft.com/jbm
Creating & writing about data vis for @datawrapper.de
Reducing the distance between data and using data / Tableau Visionary Hall of Fame / Navigating parenting and taking care of parents / Novice glassblower / Mainer
explanation graphics; author (latest: let’s get Infografit, 2025); happy to be alive! working on a book about visual language…perhaps ready in 2026
Over-analyses TV series, music, my cat and Eurovision in #dataviz
By day, data analyst at LinkedIn
Tableau's #VizoftheDay three times, Top 10 in #Ironviz in 2021
Website: https://curiousdata.netlify.app/
She/her
Head of Visual and Data Journalism @financialtimes.com; Honorary Prof @UCL Social Data Institute. Views expressed are my own. Reposts are not necessarily endorsements.
Your Jeopardy! pal. Author of THE COMPLETE KENNECTIONS (http://bit.ly/4qUcbhK) and a bunch of other stuff.
The 76th most followed account on bluesky. I will NOT be updating this ranking when it’s no longer true
A curious generalist who loves making things.
👋 https://www.davidbauer.ch
📨 https://www.weeklyfilet.com
🧯 https://www.republik.ch/challenge-accepted
🕹️ https://www.youdontknowafrica.com
🤔 https://www.dataguessr.com
📚 https://www.davidbauer.ch/bookshelf
Associate professor of statistics and data science at the University of St Thomas. Into data visualization and reproducible research, obsessed with R. pronoun.is/she
website: amelia.mn
mastodon: @vis.social/@amelia
Data & information designer 🍋 Co-founder of the DataSuffragettes 🍋 Creative director of Nightingale, journal of datavizsociety 🍋 bobbaddict
Datavisualization and data-art, one woman studio: illustrating data on social issues, mental health, science, culture.
Born in the 70s, NL (Brabo), 🏳️🌈 mother of 2 teens, macro photographer
An Independent Data Visualisation Expert educating, inspiring, and celebrating data viz excellence, everywhere since 2010.
🇬🇧 in 🇮🇪
It’s all here http://visualisingdata.com/
MSNOW contributor
Former Washington Post columnist
Book: "The Aftermath: The Last Days of the Baby Boom and the Future of Power in America"
Newsletter: https://howtoreadthisch.art
Email: hello@pbump.com
Signal: pbump.11
CEO of dataliteracy.com, author of nine books on data and AI including Avoiding Data Pitfalls and AI Literacy Fundamentals
Cartography is my passion & profession. Author of CARTOGRAPHY. & THEMATIC MAPPING. Maps+drums+beer+snowboards+footy+politics+sarcasm. 🇬🇧 in 🇺🇸 Views mine. links.esri.com/mappyhour
JasonForrestAgency.com, Data Vandals, Editor-in-chief of Nightingale, Electronic Musician, Ex-McKinsey. Contact & more: http://jasonforrestftw.com
Obsessed with data graphics. I design high‑stakes charts.
Founder, Visionary Press • CHARTOGRAPHY weekly
Talks • workshops • consulting → infowetrust.com
Head of data journalism at The Economist
Information design and data visualization studio focused on the environment, social development, and governance.
Montreal (since 2013).
English and French
Interactives, dashboards, reports, presentations, training
Posts by Francis Gagnon, founder
Designer, journalist, and professor.
Author of 'The Art of Insight' (2023) 'How Charts Lie' (2019), 'The Truthful Art' (2016), and 'The Functional Art' (2012). NEW PROJECT: https://openvisualizationacademy.org/
The FT’s team of reporters, statisticians, illustrators, cartographers, designers, and developers work with colleagues across our newsrooms, using graphics and data to find, investigate and explain stories.
https://www.ft.com/visual-and-data-journalism